


The grid that revealed how matches actually unfold
When I first started tracking how Premier League matches play out half by half, I built a simple grid: home/draw/away at half-time crossed with home/draw/away at full-time. Nine cells. Over a full season of 380 matches, I plotted where each game finished. The grid wasn’t even close to evenly distributed.
About 35% of matches ended draw-then-home or draw-then-away. About 18% were home-home — favourite leads at the break, wins comfortably. Only 4% were away-home or home-away — the half-time leader actually got overtaken. That uneven distribution is exactly what the half-time/full-time market exists to monetise, and understanding the shape of it is the first step to betting it sensibly.

How the nine outcomes get priced
The half-time/full-time market — usually shortened to HT/FT in UK shops and apps — is constructed by mapping match progress through two states. The bookmaker has to price each of the nine joint outcomes: HH, HD, HA, DH, DD, DA, AH, AD, AA.
The most likely outcomes for a Premier League favourite at home against a mid-table side are typically HH (favourite leads at HT, wins FT) at 5/2, DH (level at HT, favourite wins FT) at 11/4, and DD (level at HT, level at FT) at 9/2. Those three usually combine to about 60% implied probability across the nine-cell market.
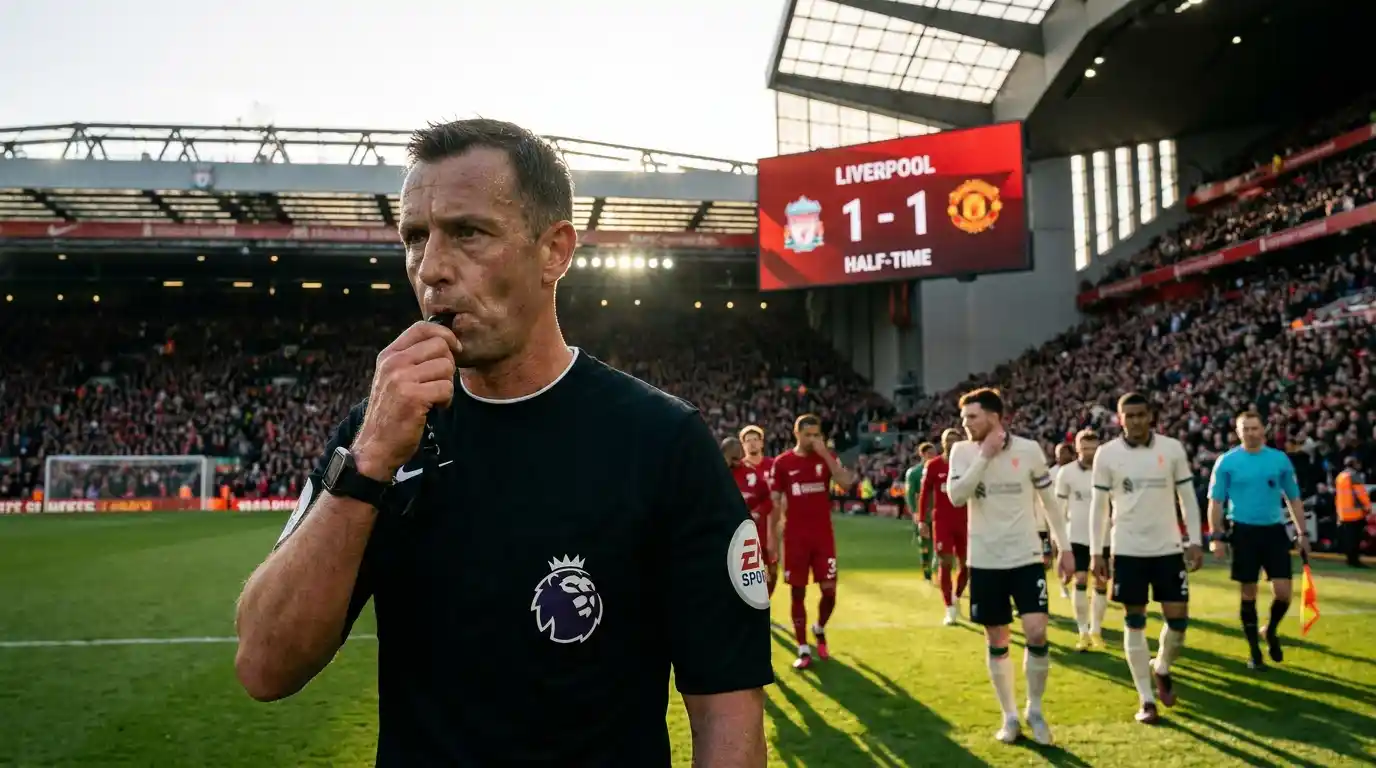
The least likely outcomes — and the longest prices — are AH and HA, where the half-time leader gets overtaken. These typically price 25/1 to 50/1 even on close fixtures, because the actual frequency of half-time-lead overhauls in the Premier League is around 3-5%. The price looks generous but the underlying probability is genuinely low. That price-probability matchup is roughly fair on these long-tail outcomes, which is unusual for football markets where long-tails are normally over-priced.
Why DH and DA are the most useful cells
The two “level at half-time, decisive at full-time” outcomes are where I spend most of my HT/FT thinking time. They’re priced around 11/4 to 3/1 on Premier League fixtures, which means roughly 25-27% implied probability. The actual probability sits closer to 28-32% depending on the fixture profile.
Why is the model under-pricing these outcomes? Because retail flow concentrates on HH (favourite ahead all match) and DD (low-scoring stalemate). Operators don’t need to compress overround on DH/DA because the volume isn’t there. The price stays slightly long.
The fixtures where DH genuinely sings are where the favourite is a strong team coming off European football and starts slowly — they often go in level at the break but find their rhythm in the second half. The fixtures where DA sings are where the underdog is fresh and the favourite has been over-priced relative to a recent dip in form. Identifying these requires watching the team rather than just reading the prices.
HH versus straight match-result outright
Punters often ask whether HH is worth the price over straight match outright. The numbers usually answer no. A Premier League favourite priced 4/6 to win outright might be 5/2 HH, which is 28.6% implied. But the actual HH frequency — favourite ahead at HT and winning at FT — is around 30-35%. The price isn’t bad, but the lift over outright is small.
The lift only matters if the favourite is short. At 1/3 outright, the punter is paying steep money for an event that’s 75% likely. Splitting the bet between HH (5/4) and DH (11/4) covers about 60% of the outright probability at a blended price around 7/4. That’s a meaningful uplift if you’re betting volume on short-priced favourites.
This combination approach is essentially a homemade correct score positioning via the HT/FT market. You’re saying “I think the favourite wins, but I want a better price than 1/3, and I don’t mind sacrificing the HA tail.” That’s a fair trade-off if your read on the fixture is that the favourite will win convincingly but might be slow out the gate.
The DD trap and what under 2.5 buyers should know
DD — level at half-time, level at full-time — is the market’s most consistent retail draw. Punters who like under-2.5-goals fixtures gravitate to DD because it pays better and the bet feels more specific. The trade-off is real but not always in the punter’s favour.

A fixture priced 9/4 for under 2.5 goals usually has DD around 9/2 to 5/1. The under 2.5 covers any final score of 0-0, 1-0, 0-1, 1-1, 2-0, 0-2 — six correct scores totalling about 40-45% of the joint probability. DD covers only 0-0 and 1-1 — about 22-25% of the joint probability. The price ratio is 9/2 versus 9/4, which is 100% wider, but the probability ratio is only 50% smaller. The DD price is structurally a slightly worse expression of the same view.
The exception is when you have a strong tactical read that both teams genuinely don’t want to push for the win. That’s rare in the Premier League — only the last few rounds of the season, and only specific safe-from-relegation-but-not-quite-European fixtures. When those fixtures appear, DD does outperform straight under-2.5.
Half-time market on its own
The half-time market — sometimes “first half result” — is an underrated standalone proposition. It’s only 45 minutes of football and the prices reflect that compressed window. Premier League favourites usually price 6/5 to 11/8 to lead at half-time when they’d be 8/13 outright. The draw is shorter — typically 6/4 to 13/8 — because more first halves end level than full matches.
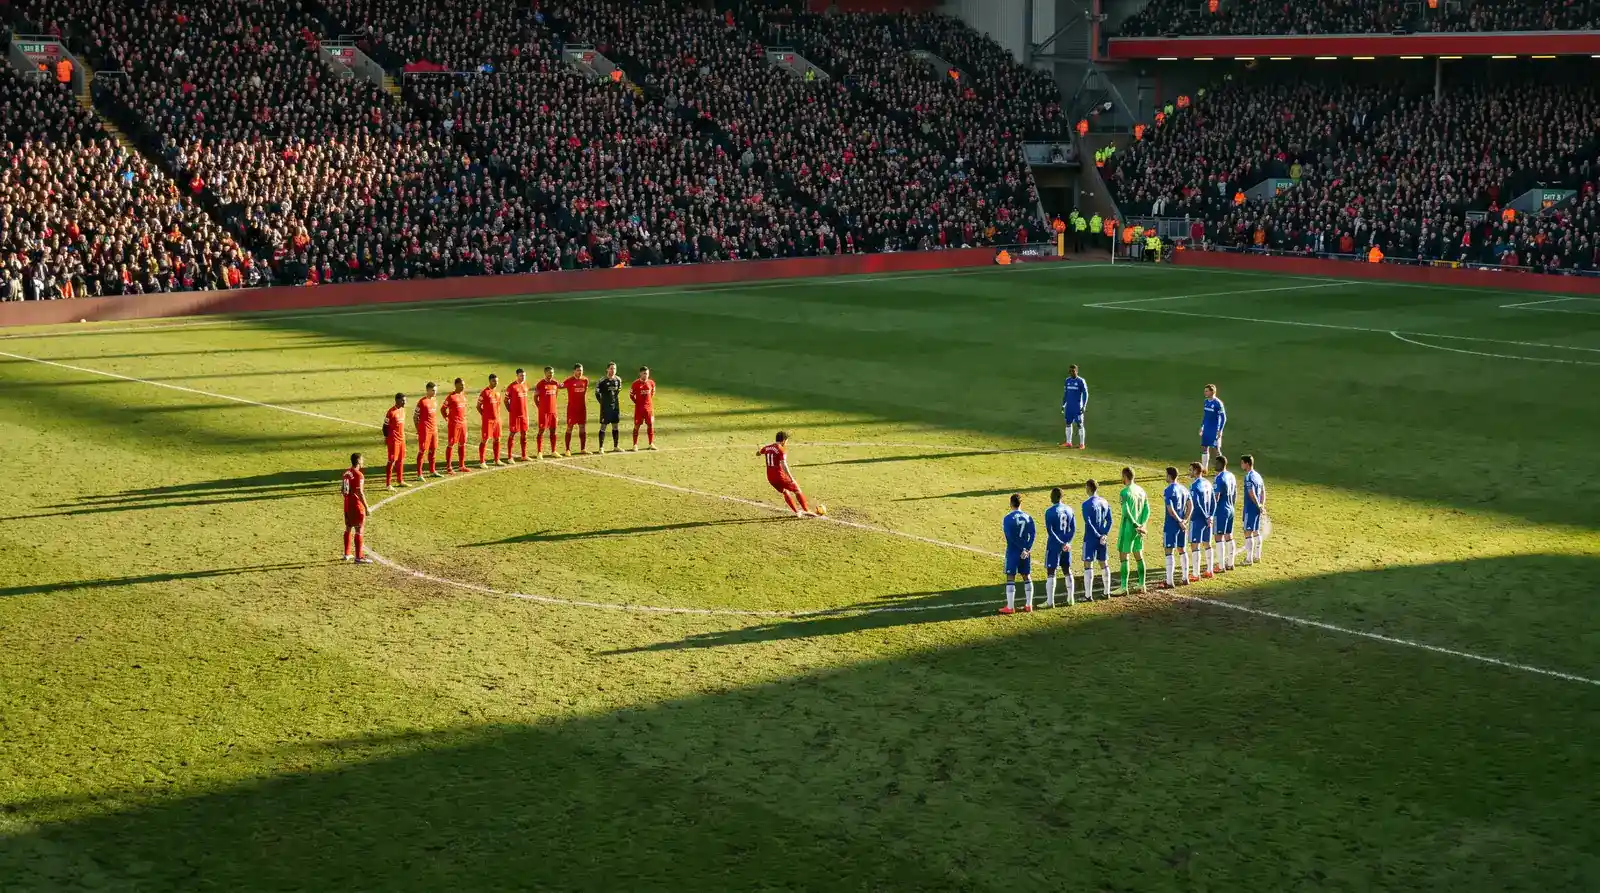
What makes the half-time market interesting is that it isolates the early-game tactical setup from late-game adjustments. If you have a strong read that the favourite will struggle to break down a defensive opponent before the break, the half-time draw at 11/8 is a clean expression of that view. You don’t have to be right about whether the favourite eventually breaks through — you only have to be right about the first 45 minutes.
The market also benefits from tighter overround than HT/FT. Most UK operators price the half-time 1X2 at 104-106% overround, compared to the full HT/FT grid at 108-112%. UK gambling reported £1.3bn in football GGY last year and the half-time market makes up a tiny but growing fraction of that, helped by live streaming on apps making the first 45 minutes feel more like a discrete event.
How to combine HT/FT with player markets
The strongest application of HT/FT in 2026 is as a leg in same-game multis. The bookmaker has to price the correlation between HT/FT outcomes and individual goalscorer/card/shot markets, and the correlation pricing isn’t always tight.

“DH and favourite striker to score anytime” is a standard combination. The bookmaker’s pricing engine knows that if the match is level at half-time and the favourite wins, there’s elevated probability that the favourite striker scored. So the combo price has a correlation discount built in. But the discount is usually conservative — the operator doesn’t want to over-discount and lose margin on a popular combination.
Look at the implied probabilities of the two legs separately, multiply them, then look at the displayed combination price. If the displayed price is more than 15% better than independent multiplication, the bookmaker is being cautious and there’s room. If the displayed price is 25% or worse than independent multiplication, the bookmaker has compressed too aggressively and the value is gone.
What HT/FT teaches about fixture analysis
The discipline that HT/FT betting forces — thinking about how a match flows across 90 minutes rather than just how it ends — is genuinely useful for every other football market you’ll touch.
Punters who instinctively think in terms of “how does this game start, what changes at half-time, who pushes hardest in the final 20 minutes” tend to price every market more accurately than punters who only think in outcomes. The HT/FT grid is the most direct way to learn that habit. Even if you never bet HT/FT itself, the mental model of nine joint outcomes pays for itself across the calendar.
Is HH better value than straight match-winner on a short-priced favourite?
Sometimes. The favourite priced 1/3 outright is paying 75% implied for a likely outcome. Splitting between HH at 5/4 and DH at 11/4 can blend to around 7/4 and still cover most winning paths. The trade-off is sacrificing the HA tail and accepting that very-late winners cost you the bet.
Why are the longest HT/FT prices not as exploitable as long-tail correct scores?
Because the actual probabilities of HA and AH outcomes are genuinely tiny — around 3-5% in the Premier League. The 25/1 to 50/1 prices look fat but they correspond to real underlying rarity. Long-tail correct scores like 4-3 or 5-1 have similar prices for slightly different reasons related to scoring distributions.
Should I bet half-time only, or always combine with full-time?
Half-time-only is the cleaner bet when you have a tactical read on early-game flow. It avoids the noise of late substitutions, red cards, and tactical changes. HT/FT is the better bet when you have a structural view of how a team plays both halves — different from how they start versus how they finish.
This material was created by the Pitchledger team.
