


The market that nearly every UK punter starts with
Walk into any UK betting shop on a Saturday afternoon and the goalscorer market is what people are writing on their slips. Not match outcome, not BTTS — first goalscorer or anytime goalscorer on whoever they’re convinced will get on the scoresheet. It’s the most retail-friendly market in football because it requires no model and very little knowledge: pick the striker, back him to score.

That accessibility is exactly what makes the goalscorer markets so heavily juiced. Operators run anytime goalscorer at overrounds well north of 110% on most Premier League fixtures, and the first/last variants run hotter still. If you’re going to play these markets, you need to understand how they’re built before you can find the spots where they’re priced reasonably.
How anytime goalscorer odds get built
Anytime goalscorer prices start from a single number per player — expected goals per match, sometimes called xG per appearance. For a Premier League first-choice striker that number sits between 0.45 and 0.85. The bookmaker translates that into a probability of scoring at least once using a Poisson distribution, which is a piece of statistics that just means “probability of getting at least one event when events arrive at this average rate”.

A striker with 0.55 xG per match has about a 42% probability of scoring at least once. Fair price would be 11/8 in fractional or 2.38 in decimal. The actual displayed price is usually 5/4 or 6/5 — 2.25 or 2.20 in decimal. That’s an overround of around 7-8% baked into a single player’s price. Multiply that across the 20-plus players on each team’s anytime list and you can see why the total market overround sits north of 110%.
Different operators use different xG inputs, which is why goalscorer prices vary between books more than 1X2 prices do. The variation isn’t huge — maybe 5-10% on a player priced 2/1 — but it’s enough that price-shopping for goalscorer selections usually pays for itself within a couple of fixtures. The same player priced 9/4 at one operator and 5/2 at another represents an 11% price difference for an identical bet.
First goalscorer — the highest-margin retail market
First goalscorer is the market UK shops have priced since before the war, and the legacy pricing structure still shows. The market is built on the back of the anytime goalscorer numbers but with a sharp adjustment for “first” probability, which incorporates timing of scoring within the match.

A striker priced 5/4 anytime might be 13/2 to score first. The implied probabilities: 44% anytime, 13.3% first. The ratio is roughly 30% — meaning of all his anytime scoring outcomes, about 30% are first goals. That’s not unreasonable for a player who scores often. But check the maths across the full first goalscorer market: implied probabilities usually sum to 130-140%, against 110-115% on the anytime market. The first goalscorer market is the worst-priced football market in the UK retail book.
Why bet it at all? Two reasons. First, the payout multiples are large enough that one or two hits a season can produce meaningful returns. Second, the “no scorer” option — typically priced 9/2 to 6/1 on a low-scoring fixture — sometimes carries value on tactical defensive matchups. But betting first goalscorer on the favourite striker at 5/1 against a mid-table opponent? That’s just paying for the romance.
Last goalscorer and the time-asymmetry it captures
Last goalscorer is the mirror image of first goalscorer, but it behaves differently because of how goals distribute through a football match. More Premier League goals are scored in the second half than the first — typically 53-55% — and more in the final 15 minutes than any other 15-minute window.
That distribution shifts the calculation. Late substitutes — typically attacking midfielders or impact strikers — have an outsized share of last goalscorer outcomes relative to their anytime numbers. A bench striker who plays 25 minutes per match might be 12/1 anytime but 16/1 last goalscorer. That’s a structurally different proposition from his first goalscorer price.
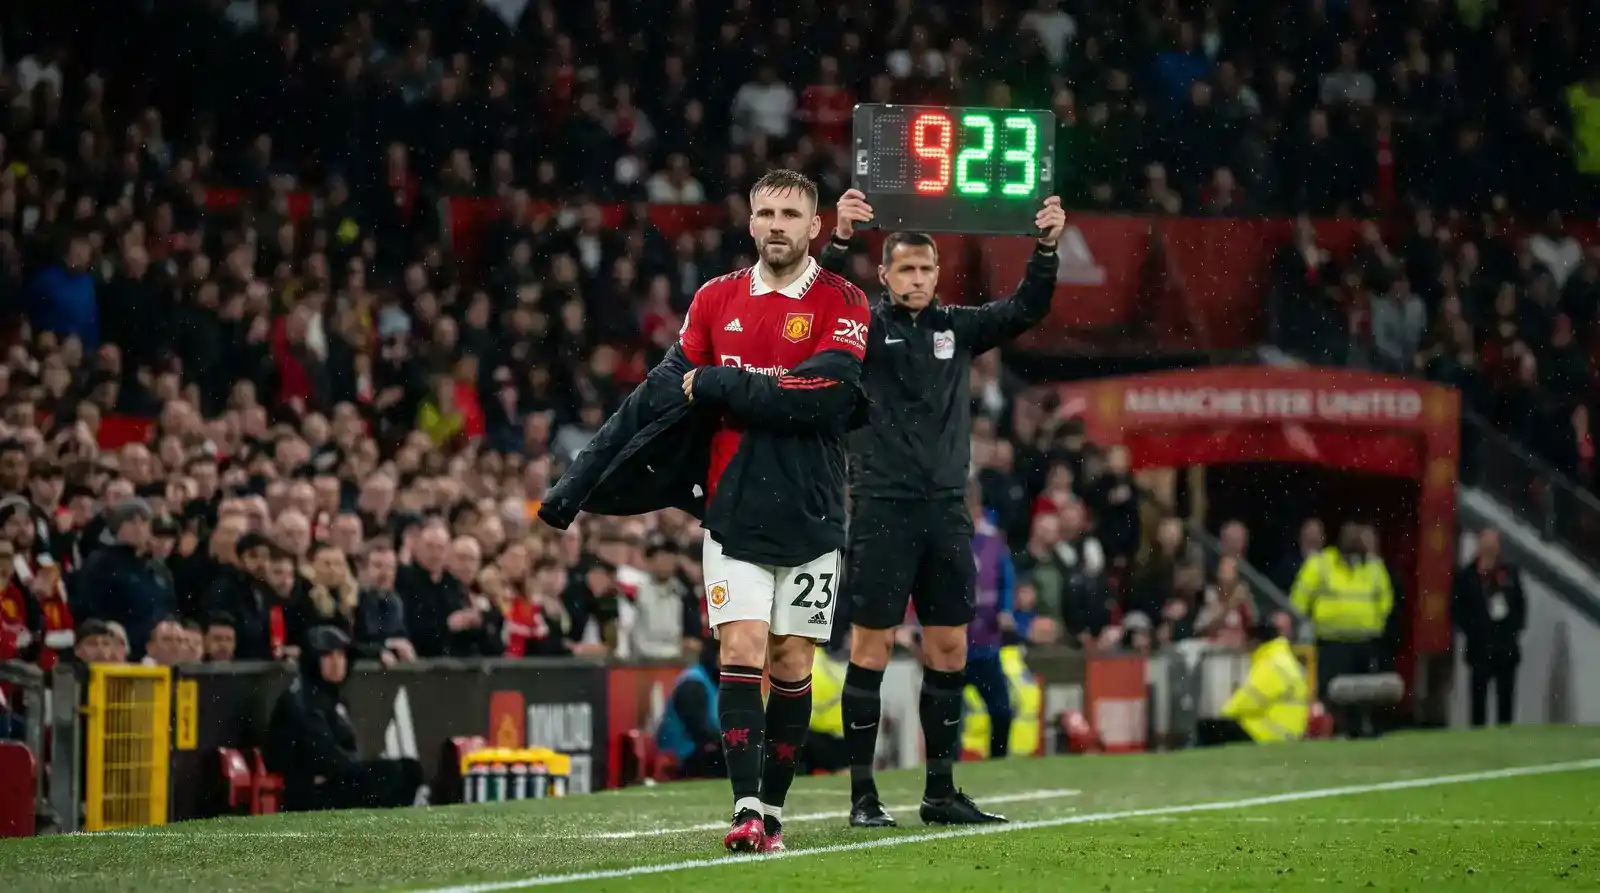
Where last goalscorer occasionally offers value is the very-late impact sub on a chasing team. A team trailing 1-0 in the 75th minute throws on attacking players, gets desperate, and either scores an equaliser late or loses 2-0 to a counter-attack. Either outcome puts a substitute on the last goalscorer line. The price doesn’t always reflect that combined probability.
The own goal trap
Every UK operator settles goalscorer markets with the same rule: own goals don’t count. If the goalkeeper’s deflection sends the ball into his own net, that’s an own goal, not a goal credited to the attacking striker — even if the striker took the shot. This rule has cost UK punters more money than any other single settlement convention.
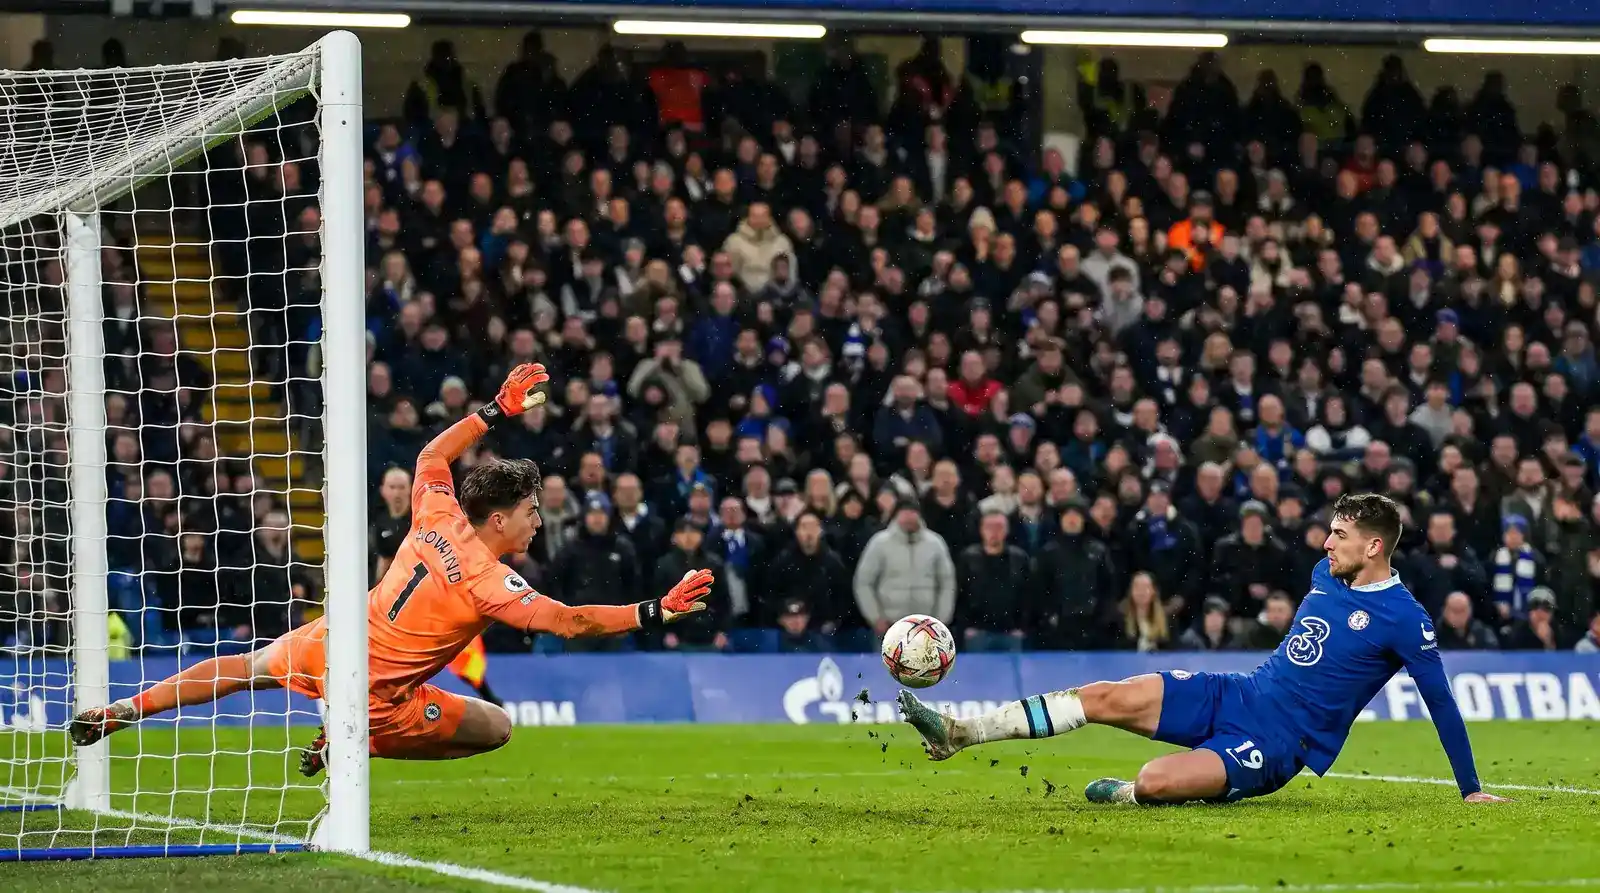
About 5-6% of Premier League goals are own goals. If your anytime goalscorer bet on the favourite striker is priced 4/5, the bookmaker has implicitly built that 5-6% own goal rate into the price. The 4/5 looks like value relative to a 50% scoring probability, but the actual scoring-credited probability is closer to 47%. The gap is small but it’s persistent — every season, every fixture, every striker.
The own goal rule also means that when a team scores three goals and one is an own goal, the “two or more goals” hat-trick markets only count the two credited goals. That makes hat-trick prices look slightly more achievable than they actually are. Bookmakers haven’t moved the goalposts on this convention because no one has ever pushed hard enough to make them.
Hat-tricks and the long-tail of player markets
Player to score two or more goals and player to score a hat-trick are the extension lines of the anytime market. A striker with 0.65 xG per match has roughly 11% probability of scoring two or more in a single match and 1.8% probability of scoring three or more.
The prices: two or more typically 9/2 to 13/2 on a top striker, hat-trick 16/1 to 25/1. Implied 13.3% to 18.2% for two-plus, 3.8% to 5.9% for hat-trick. Compare to model: substantial overround on both, with hat-trick overround particularly fat because retail flow on hat-trick markets concentrates on three or four star strikers and the bookmaker pads margin accordingly.
Where these extension markets genuinely add value is in combination with match outcome. “Striker to score and team to win” combinations usually trade at 5-10% overrounds, much tighter than either market alone, because the bookmaker can model the correlation precisely. A favourite striker priced 4/6 anytime and his team 8/13 to win usually combines into a “score and win” price around 11/8, whereas the pure independent multiplication would give 6/4. That correlation discount is the operator’s protection against the obvious dual-correlation bet.
Where I find goalscorer market value
Three places. First, second-choice strikers at mid-table teams when the first choice is injured — these prices are slow to update and the bookmaker is working off limited team-news. Second, midfielders priced 3/1 to 5/1 anytime at top teams who consistently arrive in the box — the goalscorer model under-weights midfielders relative to their actual xG share. Third, the “and team to win” correlated parlay on mid-table favourites, where the correlation discount is built into a market that retail flow doesn’t price-shop.

The market overall is structurally bad for the punter — overrounds are heavy, settlement quirks favour the bookmaker, and information edges are small. UK gambling reported 24.4M active accounts across the licensed market, and a meaningful proportion of those accounts touch goalscorer markets every weekend. Bookmakers price the markets confidently because they know the volume. Price-shop ruthlessly. Avoid first goalscorer except on tactical underdog matchups. And remember: own goals don’t count, no matter how unfair that feels in the 89th minute.
No. Different operators use different xG inputs and different overround targets, so the same player"s anytime price can vary 5-10% across UK books. Price-shopping on goalscorer selections is one of the easier ways to add 3-5% expected value over a season of betting these markets. It"s a legacy of UK shop pricing, where the first goalscorer market has always run at 130-140% implied probability sum. Operators don"t compress this overround because retail flow concentrates here regardless of price. It"s the worst-priced market in UK football betting and should generally be avoided except on tactical defensive matchups where the "no scorer" price has value. It loses. Own goals don"t count for anytime, first, or last goalscorer settlement, regardless of which player took the shot that deflected. This convention is universal across UK operators and built into the pricing model. It costs UK punters real money every season.Are anytime goalscorer prices the same at every UK bookmaker?
Why does the first goalscorer market overround look so high?
What happens to my goalscorer bet if the player scores an own goal?
This material was created by the Pitchledger team.
