


The losing bet I felt good about, and what changed my thinking
A Championship fixture, several seasons ago. I backed a mid-table side at 11/4 against a side third in the table at the time. The bet lost — favourite won 2-0. But I felt fine about it. My probability estimate had been 38% for the underdog; the implied price was 26.7%. The bet had been positive expected value. The outcome was random.
That moment was when value betting clicked for me as a framework. Most punters evaluate bets by outcome — did this bet win? Value betting evaluates bets by process — was the probability I assigned to this outcome higher than the implied probability in the price? Those are completely different questions, and the second is the one that determines whether you make money over a season of betting.
The simple maths of expected value
Expected value (EV) is the probability of an outcome multiplied by the payout, minus the probability of the alternative outcomes multiplied by the loss. A £10 bet at 3/1 (decimal 4.00) on an outcome you assign 30% probability gives: 0.30 × £30 (profit) − 0.70 × £10 (loss) = £9 − £7 = +£2 expected value.

That +£2 doesn’t mean you’ll win £2 on this bet. You’ll either win £30 or lose £10 — there’s no £2 outcome. The +£2 is the long-run average across many bets like this one. Run the bet 100 times and you’d expect to be up £200 in aggregate. Run it 1,000 times and you’d expect to be up £2,000. The variance around that expectation is high but the expectation itself is positive.
Negative expected value works the same way in reverse. A £10 bet at 2/1 on an outcome you assign 25% probability gives: 0.25 × £20 − 0.75 × £10 = £5 − £7.50 = −£2.50 EV. Run that bet 100 times and you’d expect to lose £250 in aggregate. The individual bet might still win — but the strategy of placing it over and over loses money.
Where probability estimates come from
The hardest part of value betting isn’t the maths — it’s generating probability estimates you can trust. Most retail punters use gut feel, recent results, and the headline numbers in the bookmaker’s price. That’s not estimation; that’s price-anchoring with extra steps.

Genuine probability estimation comes from one of three places. First, statistical models built on team-level performance data — shots, possession, expected goals, defensive metrics. Second, tactical analysis of how teams match up against specific opposition profiles. Third, situational factors the bookmaker model doesn’t fully weight — fixture congestion, injuries to key players, manager rotation patterns.
The skill is combining all three sources into a single probability number for the outcome you’re betting. A 40% estimate built from statistical baseline of 35%, plus tactical adjustment of +3%, plus situational factor of +2%, is more defensible than a 40% estimate built from “I think they’ll win”. The defensibility matters because over a season, you’ll need to trust your estimates through losing streaks. Estimates built from gut feel collapse the first time variance turns against you.
The closing line as the truth-teller
The most useful diagnostic for whether your value bets are genuinely value is closing line value (CLV). Closing line is the price at kickoff, which represents the market’s final assessment of the fixture’s true probability after all information has been priced in.

If you took 11/4 on a market that closed at 5/2, your bet had positive CLV — you took a price longer than the market eventually settled on. Across hundreds of bets, positive average CLV strongly predicts positive realised profit. Punters who consistently beat the closing line make money long-term. Punters who consistently take prices shorter than the closing line lose money long-term, regardless of their hit rate.
CLV is the metric that distinguishes genuine probability edge from outcome luck. You can lose a season’s worth of bets and still be a winning punter if your CLV is positive — variance will eventually correct. You can win a season’s worth of bets and still be a losing punter if your CLV is negative — variance will eventually correct the other way. Tracking CLV over hundreds of bets is the single most useful habit a value-focused punter can develop.
The market’s response to information
Football markets in the UK respond to information at different speeds depending on the market depth. Premier League outright markets adjust within minutes of major news. Championship and lower-division markets can lag by hours or days. International tournament markets sometimes lag by weeks.

That speed differential is where information edges live. The punter who reads team news first, understands tactical implications quickly, and acts before the market fully adjusts captures positive CLV on each information event. UK gambling reported £1.3bn in football GGY last year — the high-volume Premier League markets that produce most of that GGY are the markets where information edges close fastest. Lower-volume markets like League One outrights or international friendlies are where the lag is longest and where information edges persist longest.
That’s why specialised punters tend to focus on specific leagues or markets rather than spreading across everything. Becoming the punter who knows EFL League Two team news faster than the bookmaker’s model is the basis for sustainable edge. Becoming the punter who knows Premier League team news at the same speed as the bookmaker’s model is not.
Bookmaker price as evidence, not as truth
The bookmaker’s price contains information. A Premier League fixture priced 4/6 on the favourite reflects the operator’s model output, weighted by retail flow, adjusted for liability balance. That price is well-informed but not perfectly informed. It’s evidence about the true probability, not the true probability itself.
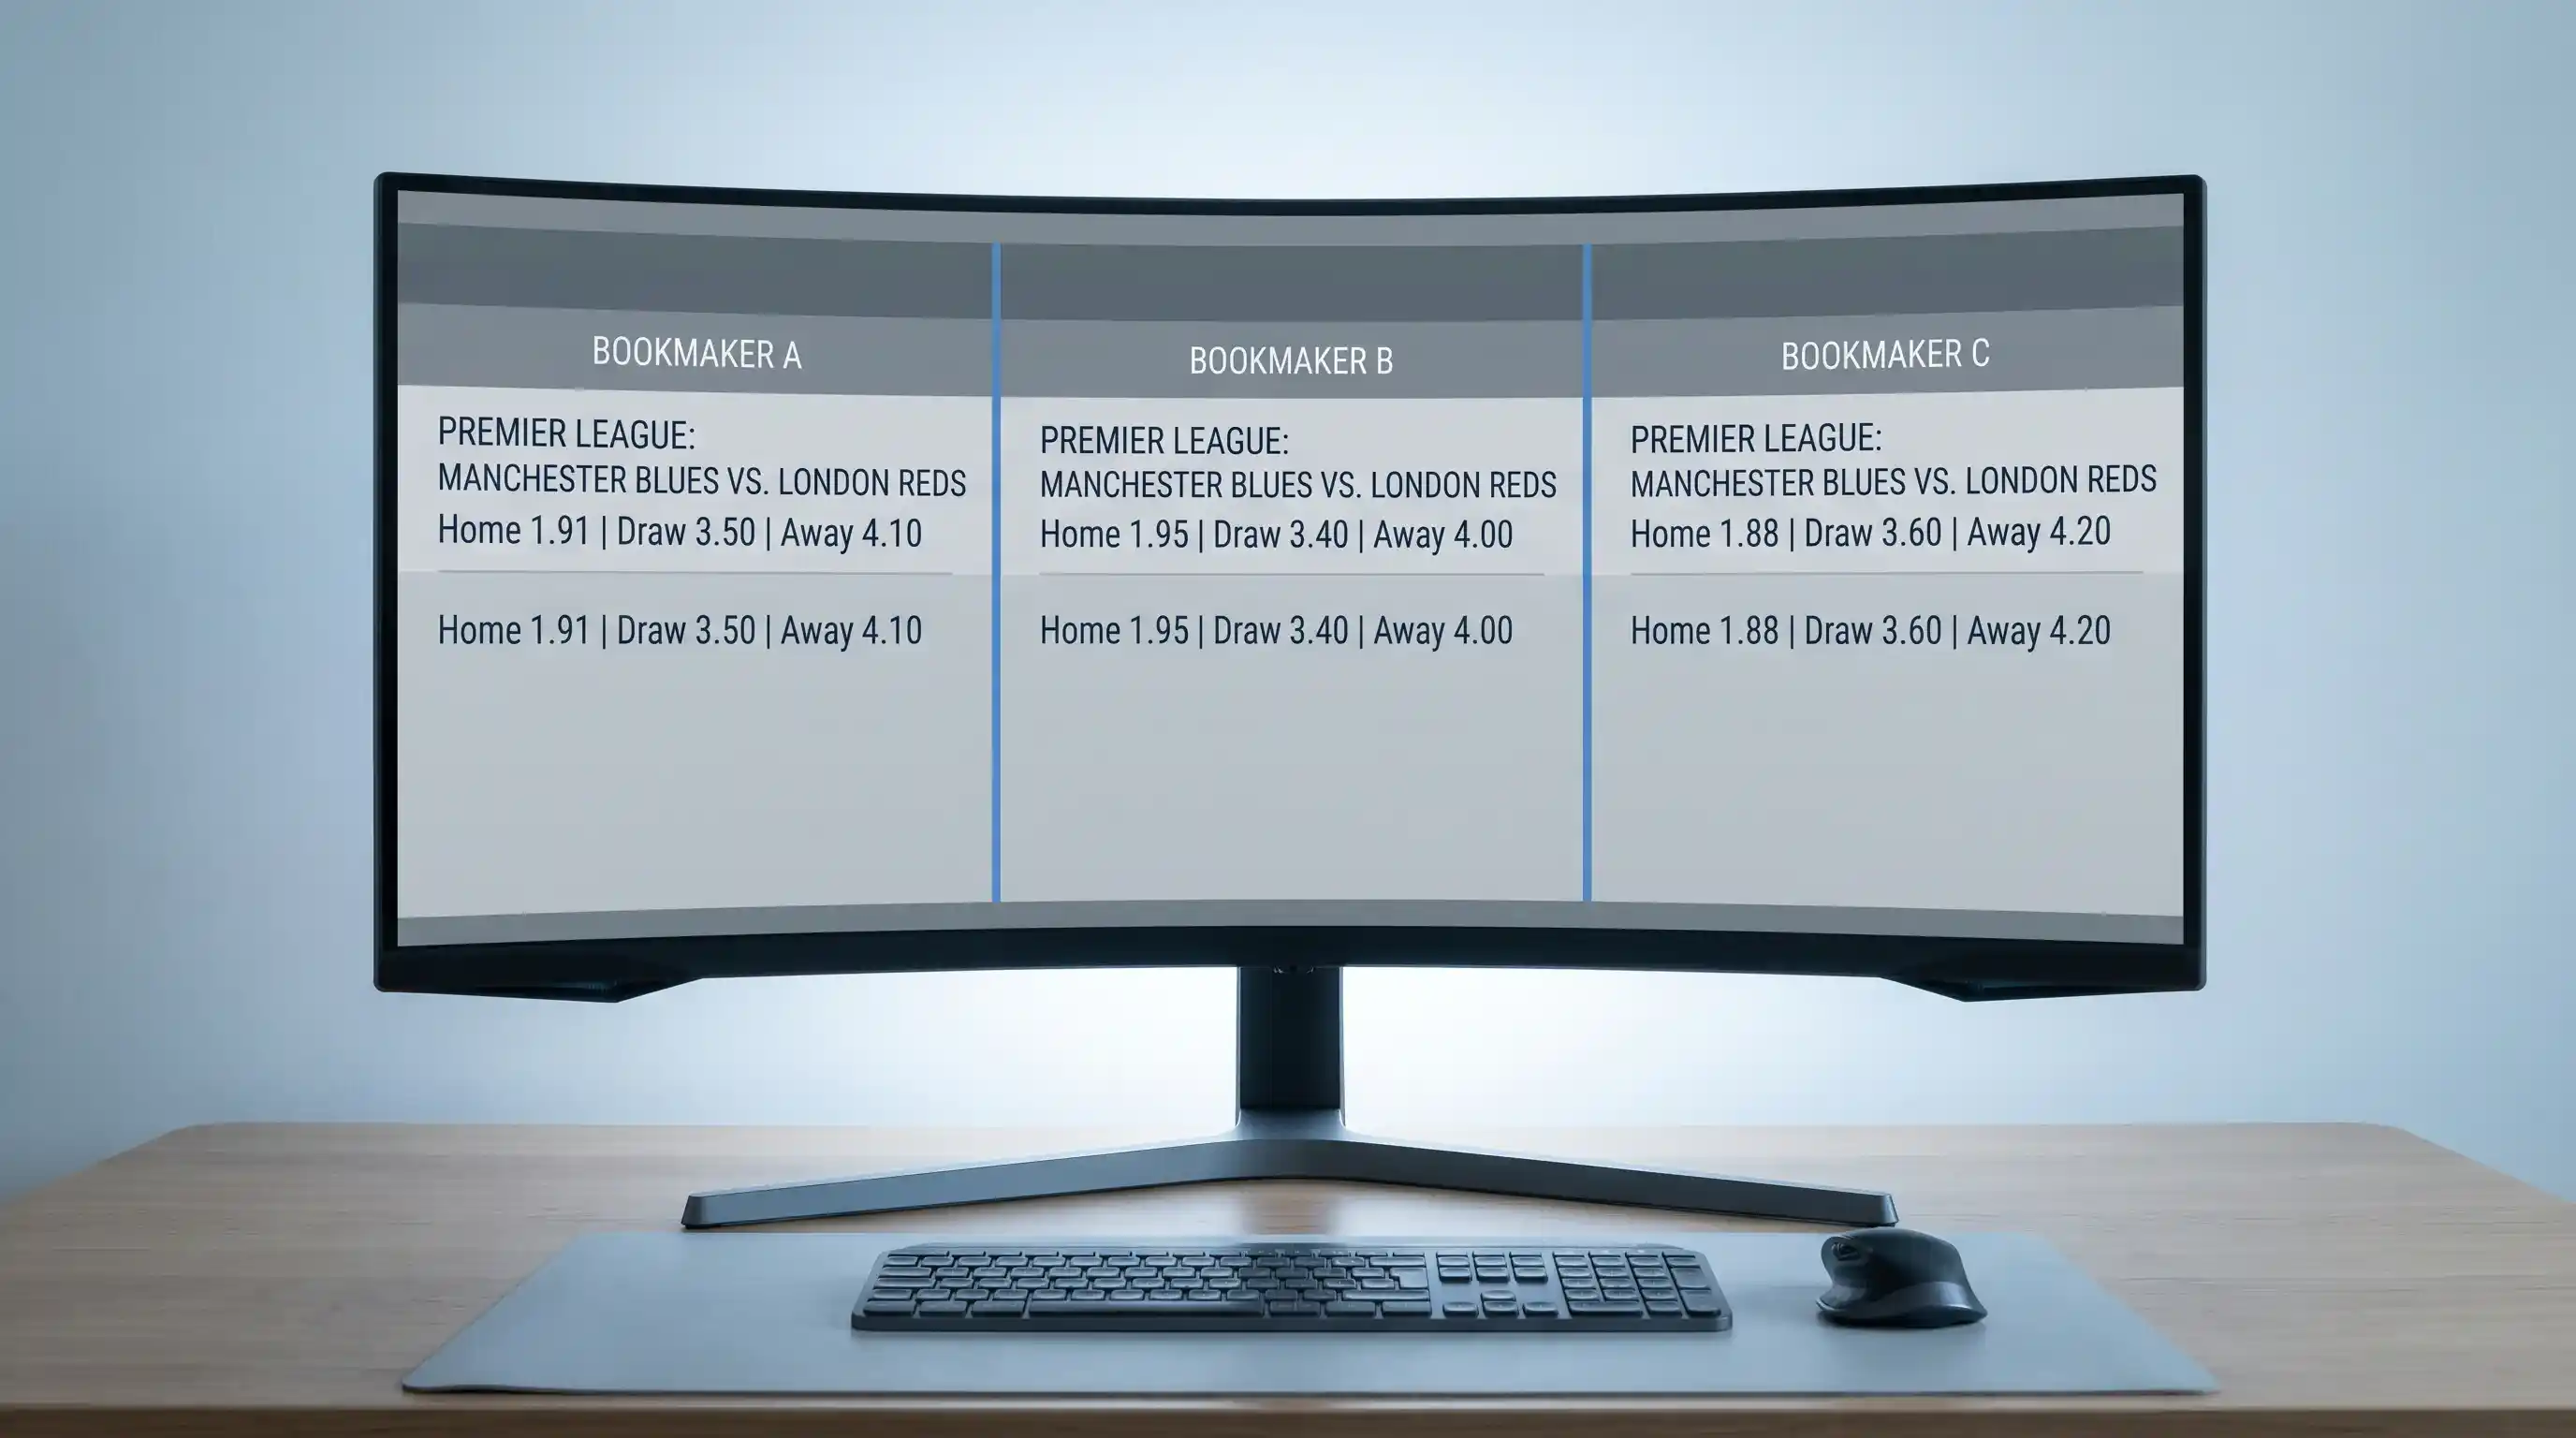
Treating the price as evidence means asking what would have to be true for this price to be value. A 4/6 favourite implies 60% probability. If your independent estimate is 65%, the bet has positive EV. If your estimate is 55%, the bet has negative EV. The price doesn’t tell you you’re right or wrong — it tells you what threshold your estimate needs to clear to make the bet worth taking.
That framing also helps avoid the trap of “betting against the favourite for the value”. A market that’s been priced 4/6 by competent operators is usually around the true probability. The fact that the favourite is short doesn’t make the underdog value — the underdog might be priced at exactly its true probability of 35-40%, in which case betting them is flat equity, not value.
Stake sizing and the Kelly fraction
Identifying a value bet is half the work. Sizing it correctly is the other half. The Kelly criterion provides the mathematical answer: stake a fraction of bankroll equal to (edge / price), where edge is the difference between your estimated probability and implied probability, and price is decimal odds minus one.

A bet at 3.00 (2/1) where you estimate 40% probability has implied 33.3% and edge 6.7 percentage points. Kelly fraction: 0.067 / 2 = 3.3% of bankroll. On a £1,000 bankroll, that’s a £33 stake. Most retail punters either over-stake (£100+ on every “good bet”) or under-stake (£5 flat regardless of edge size). Kelly-sized stakes capture the actual relationship between confidence and bankroll allocation.
Full Kelly is aggressive — it maximises long-run growth but produces high short-run variance. Most disciplined punters use fractional Kelly — half Kelly or quarter Kelly — to reduce variance at modest cost to expected growth rate. Half Kelly on the example above is £16.50 rather than £33. The lower variance lets the punter sustain longer losing runs without questioning their estimation process.
The losing streak that doesn’t mean you’re wrong
Value betting produces emotionally uncomfortable patterns. Over a season of well-selected positive-EV bets, you’ll have streaks of 8-12 consecutive losses. The maths guarantees this — 30% probability bets that win 30% of the time still produce long losing runs in random sequences.

The punters who profit from value betting are the ones who hold position size and selection discipline through the losing streaks. The punters who fail are the ones who increase stakes to “win back” losses, or switch markets looking for “easier” bets, or abandon their estimation process entirely. The mathematics of value betting is unforgiving to emotional intervention. Trust the process or don’t run the process at all.
That discipline is also what separates value betting from gambling. Value betting is a probabilistic strategy that requires consistency through variance. Trading on a betting exchange teaches similar discipline in a faster, more compressed timeframe — which is why many punters find that learning to trade improves their straight value-betting results too.
Why most UK punters don’t bet for value
Because it’s hard, slow, and unsatisfying in the short term. Value betting requires research, mathematical discipline, emotional steadiness through losing runs, and the willingness to bet on outcomes that “feel wrong” because you’ve identified that the market has under-priced them.
UK gambling reported 24.4M active accounts across the licensed market last year. The overwhelming majority of those accounts are recreational — punters who bet for entertainment, on favourite teams, on long-shot accumulators, on price-boosted markets that feel exciting. That’s a completely legitimate use of football betting and there’s nothing wrong with it. But it’s not value betting, and the punters who follow that pattern lose money on average across the season.
The minority of UK accounts that bet for value extract money from the markets the recreational majority pour into. The system is sustainable for operators only because the recreational majority’s losses fund both the operator’s margin and the value bettors’ profits. If everyone bet for value, the bookmakers would tighten prices until no one could profit. The fact that most punters don’t bet for value is exactly why value-based punters can still find edges in UK football markets in 2026.
Hit rate is the percentage of bets that win. Expected value is whether the price you took matched or exceeded the true probability. A punter with 30% hit rate at 4/1 average prices has positive expected value (4.00 × 0.30 = 1.20). A punter with 70% hit rate at 4/5 average prices has negative expected value (1.80 × 0.70 = 1.26 minus stake of 1.00 = 0.26, but the implied break-even is 55.6% — they need above that to be EV-positive at 4/5). Hit rate alone doesn"t tell you if you"re winning. Record the price you took and the closing price at kickoff for every bet. Calculate the difference as percentage CLV. Over 100+ bets, average CLV strongly predicts realised profit. Most disciplined value bettors maintain a spreadsheet showing CLV across all bets — it"s the single most useful diagnostic for whether the estimation process is generating real edge or just lucky outcomes. Hard. The Premier League is the most efficiently-priced football market in the UK, with deep retail flow keeping prices tight to fair. Information edges close within minutes of news. Most successful value bettors focus on lower-volume markets — Championship, League One, lower-tier European football — where price discovery is slower and information edges persist longer. The Premier League rewards specialisation and patience more than it rewards general value betting.What"s the difference between hit rate and expected value?
How do I track closing line value?
Can I value-bet successfully on Premier League fixtures?
This material was created by the Pitchledger team.
