


Why every football market on a UK app already contains the bookmaker’s profit
The first time I built a Premier League pricing model from scratch, I made a beginner’s mistake. I converted three probabilities into three decimal prices, added them up, and got 102.7%. I sat staring at the spreadsheet wondering where the extra 2.7% had come from. It hadn’t come from anywhere. That 2.7% is the bookmaker’s profit, baked into the prices before a single bet is placed.
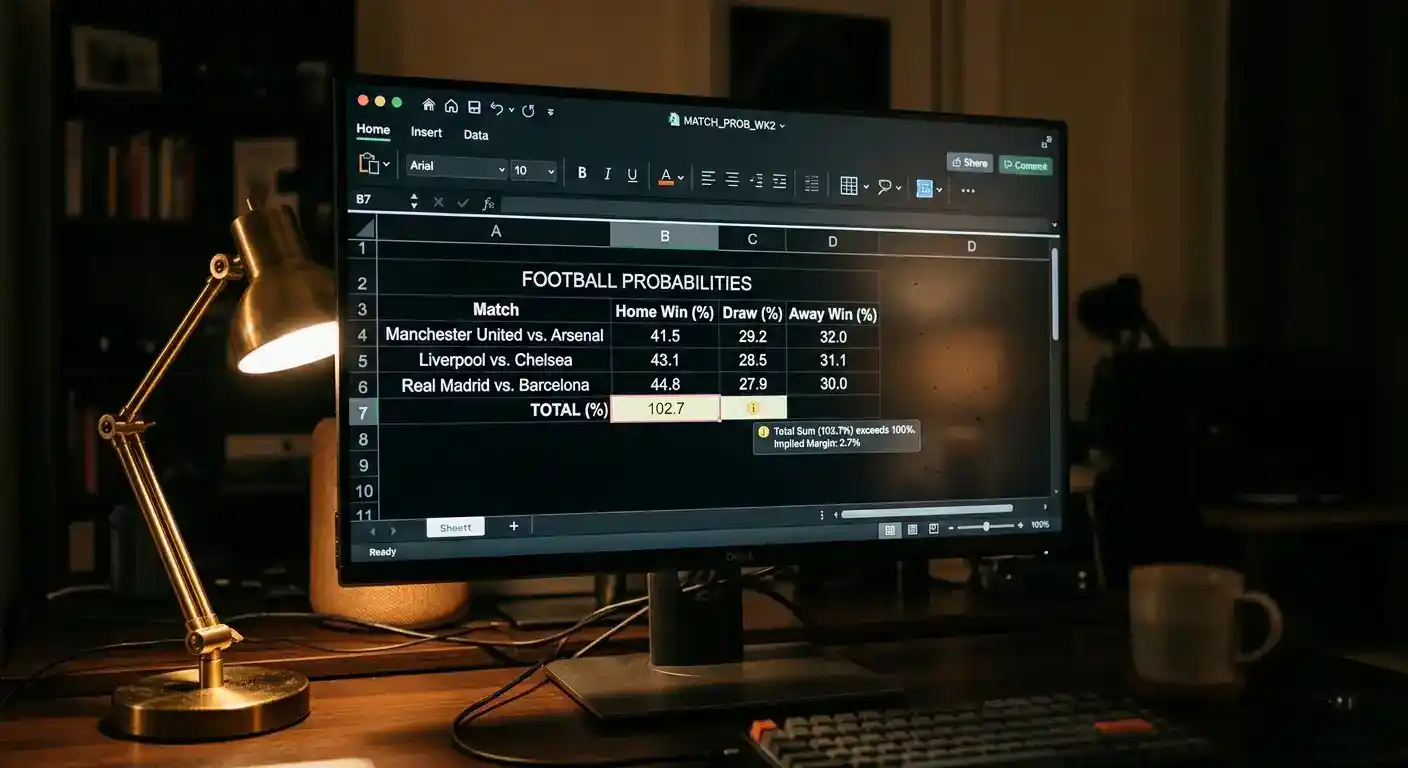
That number has a name — overround — and once you understand it, every football price on a UK app starts to look less like a forecast and more like a piece of retail pricing. The bookmaker isn’t telling you what they think will happen. They’re telling you what they’re willing to lay you, given they need a margin to keep the lights on.
This matters because UK remote sports betting generated £2.6 bn in Gross Gambling Yield in the year to March 2025, and football alone delivered £1.3 bn of that. Every penny of it came from one place — the gap between what the prices say will happen and what actually does. Understanding that gap is the first piece of literacy any UK punter should pick up before they back another match.
From probability to price — turning a model into a fractional and decimal quote
I sometimes describe odds-setting to non-trader friends as a translation job. You start with a probability — say, you think Manchester City beat Brentford 65% of the time at the Etihad. That’s the raw input from whatever model the trading floor is running. The question is how you turn 65% into a price you can put on a board.
The arithmetic is straightforward. Divide 1 by the probability and you get a decimal price. 1 ÷ 0.65 = 1.538. That’s your fair decimal odd for City. In fractional form, that’s roughly 8/15 — less common on UK apps these days but still the high-street default. Implied probability runs the other way: take 1 divided by the decimal price and you’ve reverse-engineered the bookmaker’s stated view.
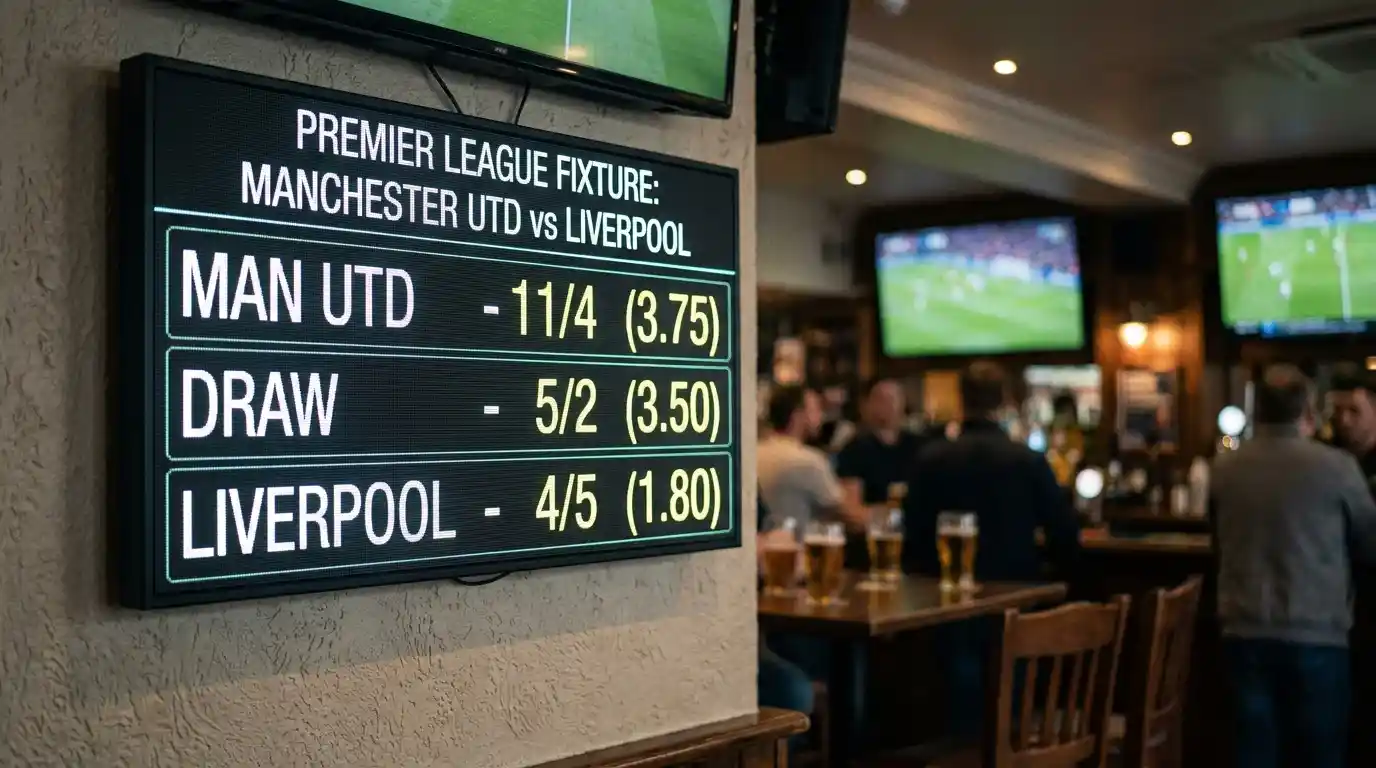
The wrinkle is that no UK bookmaker actually offers you 1.538 on Man City in that scenario. They offer something like 1.50 or 1.48, and they do the same shaving on the other two outcomes. Add the implied probabilities of the three prices back up and you’ll find they don’t sum to 100%. They sum to something north of it. The difference is your problem and their margin.
The overround — a 100%+ book and where the margin lives
Overround is the technical name for the sum of implied probabilities exceeding 100% in a balanced market. Bookmakers also call it the vig, the juice, or simply “the book”. When I’m reviewing a price card, the first thing I do is sum the implied probabilities across all outcomes. If they hit 104%, I’m looking at a 4% overround.

The simplest way to picture it is this. A genuine fair-coin market on heads or tails would offer 2.00 on each side, summing to exactly 100%. If a bookmaker offered 1.95 on each, that’s an implied 51.28% per side, totalling 102.56%. They’re charging you 2.56% for the convenience of taking the bet.
Football is harder than a coin flip because there are three outcomes — home, draw, away — and the probabilities are rarely symmetric. The principle holds, though. A Premier League match priced at 1.80, 3.80, 4.50 implies 55.56%, 26.32%, 22.22% — a total of 104.10%. That 4.10% is the operator’s overround on that market. Spread across all the football turnover going through their book, it’s the structural source of the £1.3 bn the industry produces from this single sport.
A worked example on a typical Premier League fixture
Let’s price a real-world style fixture — Arsenal at home to Aston Villa. My model says Arsenal wins 56%, draws come in 23%, Villa wins 21%. Fair prices are 1.79, 4.35, 4.76, summing to exactly 100%.
Now I’m a trader and my desk runs a 4.5% overround target on Premier League 1X2. I shave each price proportionally. Arsenal moves from 1.79 to 1.71 (implied 58.5%), the draw from 4.35 to 4.15 (24.1%), Villa from 4.76 to 4.55 (22.0%). The book now sums to 104.6% — bang on my target.

What’s interesting is where the shave bites hardest. The favourite gets squeezed in absolute price terms, but the underdog gets squeezed harder in percentage terms because punters chase value at long odds. UK operators know exactly where the recreational money sits, and the overround is allocated accordingly. William Hill held 37.83% of UK sports betting PPC click-through in February 2026, with Bet365 at 16.2%. The scale at which these operators trade is what allows them to fine-tune that allocation match by match.
Why a Conference North market runs heavier than a Premier League one
Margins are not the same across every football competition, and the reasons are entirely practical from the bookmaker’s side.
A Premier League fixture has hundreds of millions in liquid markets behind it — exchange volume, sharp groups, integrity feeds, statistical depth, an army of traders watching the same data. The market quickly converges on a tight book because anyone running a fat margin loses business to a competitor running 102%. That’s why Premier League 1X2 overrounds in 2026 typically sit between 103% and 105% at top-tier UK operators.
Drop into the National League, the Conference North, or a Welsh Premier League fixture, and the picture flips. There’s no exchange volume worth speaking of. Statistical models lose accuracy because squad changes hit small clubs harder. Integrity risk is elevated. Match data feeds carry latency. The trader compensates the only way they can — by widening the book. A 1X2 market on a Conference North Tuesday-night fixture might run 112% to 118%. The punter pays for that uncertainty in every selection they back.
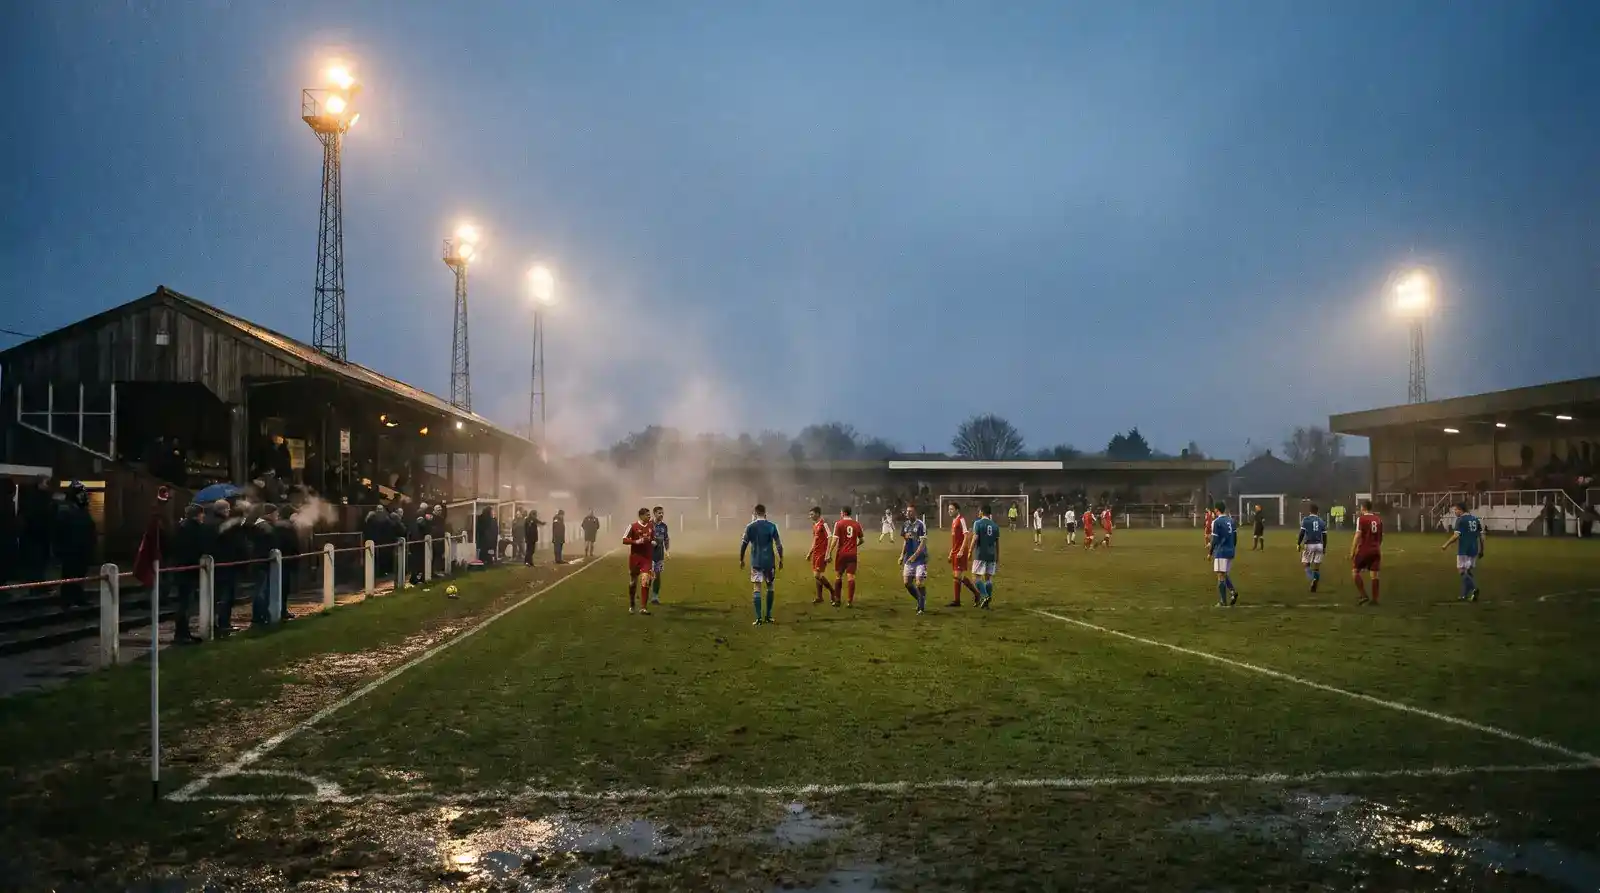
This is the structural reason I tell newer punters to stick to top-flight football early on. It’s not snobbery. It’s that you’re paying significantly less margin per pound staked.
Steam, sharp money and the way a market settles through the week
A Premier League price isn’t fixed when it opens on Monday morning. It moves continuously through the week as money flows in, and that movement is one of the more honest signals a UK punter can read.
Bookmakers tend to open prices conservatively — wider on the favourite, tighter on the underdog — partly because the sharp money tends to land first. When professional groups identify a mispricing, they move quickly and at scale. The bookmaker sees that traffic and adjusts. By Friday, a price that opened at 1.85 on a Saturday 3 p.m. favourite might be at 1.70. The market has digested team news, weather, late tactical noise.
What I look for is the late-week movement direction. Is the price moving with the public — towards the favourite as the casual money piles in? Or is it moving against the public, pulled by sharper accounts? The second pattern is rarer and usually meaningful. The first is just retail flow rebalancing the book.
One useful tell — most UK operators don’t move first. They follow. The price that moves fastest is the one to watch, and the rest of the market chases it within minutes. If you’re price-shopping seriously, you want to be checking the lines an hour or two after that initial steam, when most operators have moved but a few still carry the original number.
The literacy that pays for itself
Understanding overround changes how you read every football market you see. You stop thinking of a 1.80 favourite as “the price” and start thinking of it as the bookmaker’s quote, with a known margin baked in, sitting in a book that has to sum above 100%. That shift in mindset is the single most useful thing a UK punter can pick up.
It also makes the difference between fractional and decimal odds obvious — decimals make the maths trivial, while fractionals hide it behind tradition. If you want to push deeper into format mechanics, I’d start with how the two formats compare for UK football betting and how the choice changes what you actually see at the point of sale.
The bookmaker isn’t your enemy and they’re not lying to you. They’re running a structured retail business with a stated margin. Your job is to know what that margin is on every market you touch, and to find the corners where it’s thinnest. That’s where the only edge a recreational punter can claim actually lives.
What overround is a "fair" Premier League 1X2 market in 2026?
At the top tier of UK operators, Premier League 1X2 typically runs between 103% and 105% on flagship fixtures. Anything above 106% on a marquee Saturday 5.30 p.m. kick-off should send you elsewhere — that"s a wide book for a market with this much liquidity.
Why do some UK operators move their Premier League prices first?
A handful of operators handle the largest share of professional and exchange-linked flow, and their lines move first because they see sharper money. Most retail-led operators follow with a lag of minutes. Watching the leader and waiting for the followers is the simplest form of price-shopping.
Can two UKGC-licensed operators offer different prices on the same match?
Absolutely, and they almost always do — that"s the whole reason price-shopping works. Each operator runs its own book, its own margin target, and its own liability position. A 4-fold accumulator built at the best price on each leg can outperform the same acca placed at one operator by several percent.
This material was created by the Pitchledger team.
