


The “BTTS only” punter and the bookmaker model that targets them
Every UK pub I’ve ever been in has a man who bets BTTS and nothing else. He’ll explain it to anyone who asks — 50/50 market, easy to read, no draw to worry about, just goals and goals. He’s right that the market is appealing. He’s mostly wrong that it’s 50/50. And the operator who quoted him 4/5 (1.80) on yes and 11/10 (2.10) on no last Saturday knew exactly what he was being sold.
BTTS is one of the higher-margin football markets at UK bookmakers — typically 105% to 108% overround, meaningfully heavier than 1X2. The reason is retail concentration. A massive share of casual football betting flows through BTTS specifically because it’s emotionally easy to engage with, and operators price it accordingly. Football generated £1.3 bn of UK remote sports GGY in the year to March 2025, and a quietly significant slice of that came from “BTTS yes” tickets across a million Saturday lunchtime pubs.
How BTTS is priced from xG and goal-rate inputs
The maths underneath a BTTS price is goal-rate modelling. The operator’s model estimates each team’s expected goals against this specific opponent — call those values λ_home and λ_away. Plug them into a Poisson distribution and you get the probability that each team scores at least once. The probability of BTTS yes is the product of those two probabilities (each team scores).
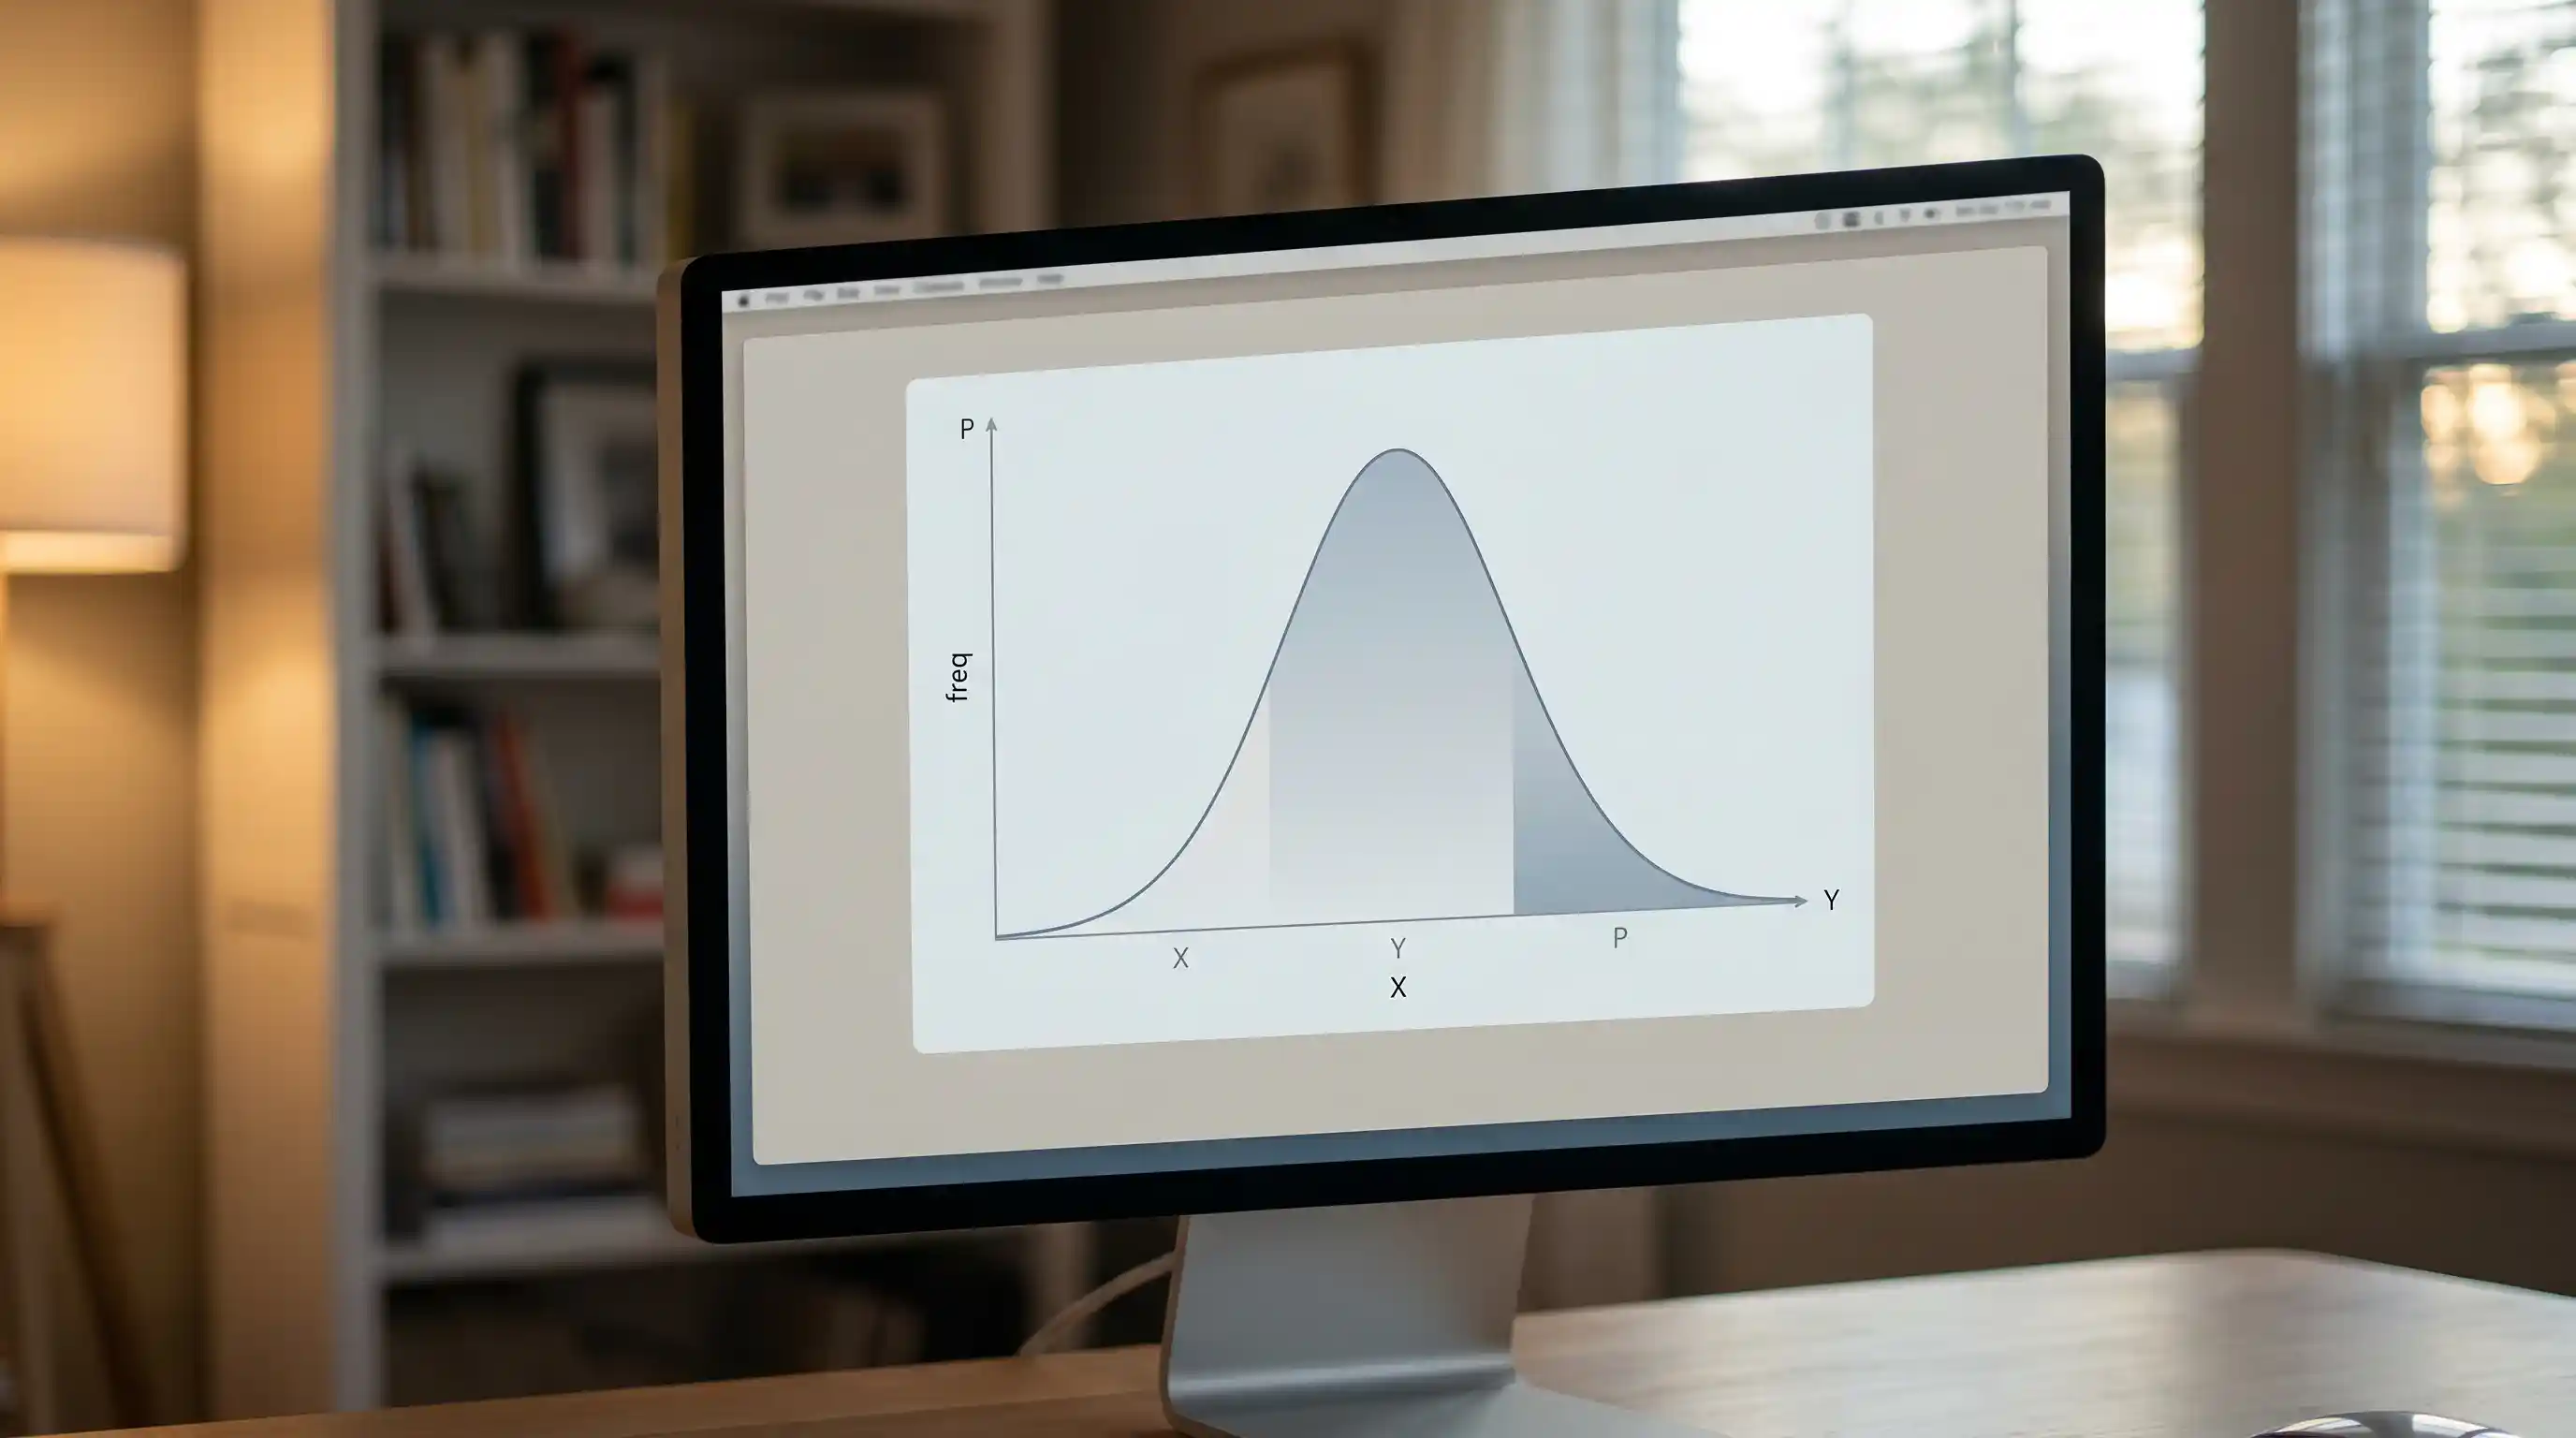
Take a tactical league average — both sides expected to score around 1.4 goals. Poisson probability of zero goals from a Poisson(1.4) distribution is e^(-1.4) ≈ 24.7%. So each side scores at least one with probability 75.3%. BTTS yes probability: 0.753 × 0.753 ≈ 56.7%. Fair price on BTTS yes: 1.76. Fair price on BTTS no: 2.31.
Operators don’t quote those fair prices. They quote something like 1.66 and 2.10, implying probabilities of 60.2% and 47.6%, summing to 107.8% — a fat 7.8% overround. The model is doing the work; the margin is being applied on top. Punters who back BTTS yes habitually are paying that 7.8% on every single bet.
What the model doesn’t capture cleanly is the negative covariance between the two sides scoring — i.e., whether one team’s goals make the other team’s goals more or less likely. In practice, defensive collapses are slightly contagious (one team scoring tends to open the game up) so the true BTTS yes probability is marginally higher than the pure Poisson product suggests. Operators know this and adjust slightly. The adjustment isn’t enough to close the value gap.
BTTS and win — a popular hybrid and its true value
BTTS-and-win is the combination market most casual punters reach for after a season or two of straight BTTS. The bet is conditional — both teams must score AND the team you back must win. Operators price it as a single product, typically around 5/2 (3.50) for a strong favourite to win in a BTTS scenario.
The maths is harder than 1X2 × BTTS because the events aren’t independent. A match where both teams score is, by definition, not a 1-0 or 2-0 — it’s at least 2-1, 3-1, 1-1, 2-2 etc. Conditional on BTTS yes, the probability distribution of outcomes shifts toward higher-scoring patterns, and the probability of the favourite winning is meaningfully different from the unconditional 1X2 probability.
Operators tend to price BTTS-and-win at a slight premium to the implied joint probability — pulling 3 to 5 percentage points of additional margin on top of the standalone BTTS overround. The product is sold as a “value boost” on plain BTTS, but it’s structurally a higher-margin variant of two markets you could place separately at lower combined overround.
Where BTTS-and-win does sometimes deliver real value is on big derbies where the operator’s pre-priced quote hasn’t fully updated for recent form. Mismatches between the joint price and the implied product of standalone prices are spottable in advance and rare but real.
BTTS in first half / second half variants
The half-time variants are the part of the BTTS menu most casual punters never touch. BTTS in first half asks whether both teams will score before the interval. BTTS in second half asks whether both teams will score in the 45 minutes after the break.
First-half BTTS is structurally harder to land than full-match BTTS — a typical Premier League match averages roughly 1.3 goals in the first half versus 1.7 in the second. Fair probability of first-half BTTS yes runs around 18–22% on a typical match. Operators price it at around 4/1 (5.00), implying 20%, with substantial overround baked in.
Second-half BTTS sits closer to 25–30% fair probability for a typical fixture, priced around 3/1 (4.00) or shorter. The product is most interesting when paired with first-half no goals — the slightly slower start to a match often opens up the second half, and the combined probability of “first-half goalless, second-half BTTS yes” is usable as a contrarian leg in same-game multis.
Why London derbies see thinner BTTS margins
This is one of the quieter operator behaviours worth tracking. Marquee fixtures — London derbies, Manchester derbies, Liverpool-Manchester United — see meaningfully tighter BTTS margins than league average. The 105–108% you’d expect on a midweek Crystal Palace at Bournemouth contracts to 103.5–105% on Tottenham at home to Arsenal.
The reason is twofold. Marquee fixtures attract sharper money, and operators tighten the books to defend against that flow. They also attract dramatically higher casual turnover — and on heavy-turnover markets, the operator’s risk is that an imbalance against the natural recreational position becomes expensive. Tighter books reduce that exposure.

Live in-play BTTS pricing on these fixtures runs even tighter during the first 30 minutes, when the operator’s data feed is still gathering match-state evidence and the implied probabilities are most uncertain. Live football is the dominant in-play category in Britain — 5% of all adults and 9% of men engage with it — so the operator’s incentive to keep margins disciplined on big fixtures is real money.
Using BTTS legs inside a Bet Builder
BTTS is one of the most common legs in same-game multis precisely because it pairs naturally with other goal-related selections. Combining BTTS yes with Over 2.5 goals is the canonical example — both markets are driven by the same underlying goal-rate model, so the operator’s Bet Builder engine has to discount the combined price for correlation.
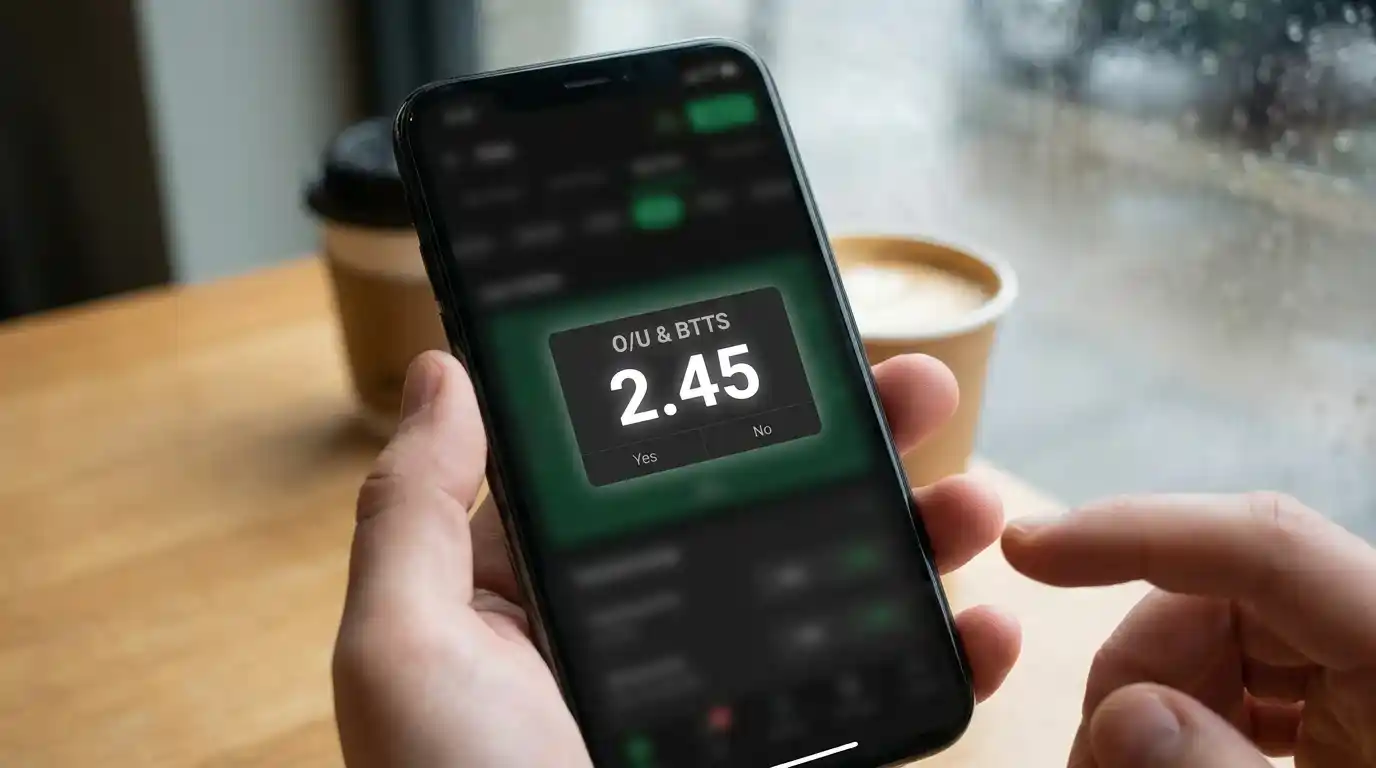
The discount varies by operator. A naive multiplication of BTTS yes at 1.70 × Over 2.5 at 1.80 gives 3.06. The correlated true price is somewhere around 2.20 to 2.40, depending on the match. Operators typically quote it at 2.45 to 2.65 — meaning the punter recovers a meaningful chunk of the correlated value, but the operator still extracts incremental margin on the combined bet.
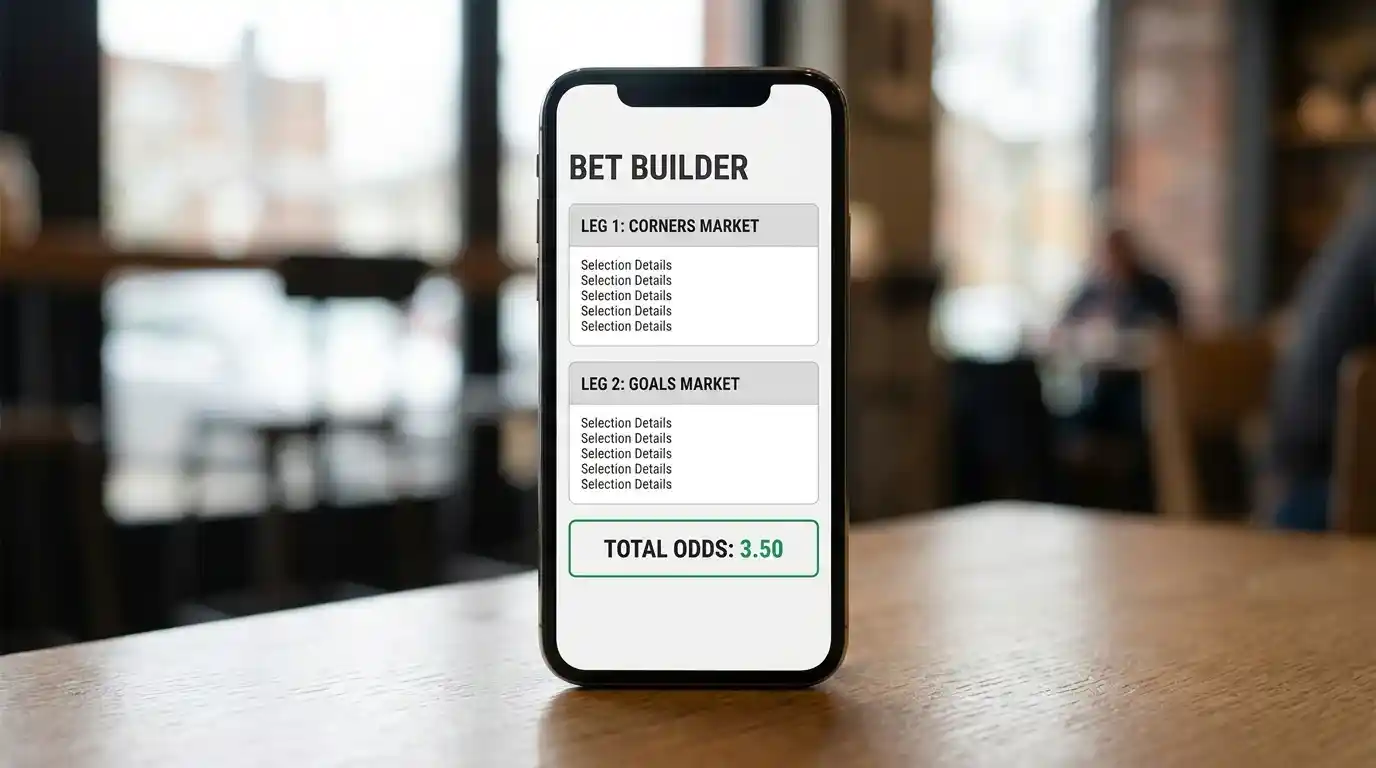
The reverse combination — BTTS no with Under 2.5 goals — is even more strongly correlated. Both legs are essentially betting on a low-scoring or no-scoring match, and the operator’s correlation discount on this combination is heavier still. The Bet Builder engines have improved at pricing these correlations over the last few years, but mispricings still appear during high-turnover periods when the engine is calibrating against unusual market conditions.
The cleanest BTTS Bet Builder combinations are with markets that have low correlation to goals — corners, cards, anytime goalscorer for a specific player. These compound more cleanly into the slip’s headline price. For a deeper look at how UK operators handle correlated and uncorrelated leg combinations across same-game multis, my breakdown of correct score football betting covers the related Poisson grid that anchors most goal-market pricing.
The market that survives because it feels simple
BTTS is the textbook example of a football market that’s commercially successful because it feels accessible, not because it’s mathematically efficient. The 50/50 framing is intuitive. The settlement is binary. The price card is easy to read at a glance. None of those features make the product good value — they make it a product that gets bet on, which is a different problem.
The mathematically literate approach is to use BTTS sparingly and selectively. Stick to fixtures where the implied probability is genuinely mispriced against the data, treat BTTS-and-win as a high-margin variant rather than a value boost, and let BTTS no carry a meaningful share of your selections — the no side is structurally underbet because punters prefer the upside of a yes ticket. The operator knows that asymmetry exists and prices for it. A disciplined BTTS no programme across a season tends to outperform a corresponding BTTS yes programme purely because the overround is allocated against retail flow.
Does BTTS settle on own goals?
Yes, at every major UK operator. An own goal counts as a goal scored by the attacking team for BTTS settlement purposes. So if Spurs put through their own net against Liverpool, the goal counts for Liverpool"s BTTS yes leg. This rule has been industry-standard for over a decade and operator-specific T&Cs simply confirm it.
Can a BTTS leg correlate with an Over 2.5 leg in the same Bet Builder?
Yes, and operators price the combination with a correlation discount. The pure multiplied price of BTTS yes × Over 2.5 yes is significantly higher than the true joint probability, because both legs are driven by the same underlying goal-rate model. The Bet Builder quote reflects that correlation by paying less than the naive product.
Why is BTTS yes often priced shorter than BTTS no?
Because casual betting flow consistently favours BTTS yes — punters prefer goals — and operators price defensively against that flow. The market isn"t symmetric on probability either; in many fixtures the true BTTS yes probability is genuinely above 55%. But the asymmetry in pricing is wider than the probability gap, which structurally favours the no side at value.
This material was created by the Pitchledger team.
