


The first model I built and the day it priced a fixture correctly
My first football model lived in a spreadsheet, ran on Premier League shots-data from the previous five seasons, and produced probability estimates for match outcomes. It took me three weeks to build and another two months to debug. The first weekend it ran in production, it priced a mid-table fixture at 38% home win against the market’s 32%. The home side won. I’d love to say I bet it confidently — I didn’t, I bet a token stake — but the moment the result came in, I understood what model-based betting was actually for.
That model wasn’t sophisticated by modern standards. But it taught me the discipline of building probability estimates from data rather than from gut feel, and the experience of seeing model output contradict market consensus and prove correct was the strongest motivation to keep developing the work. Most successful UK value bettors build their own models eventually. The question is what kind, how complex, and whether the effort matches the available edge.
What a football model actually does
A football model takes historical and current data as input and produces probability estimates for future outcomes as output. The simplest models — Poisson distributions based on team scoring rates — can be implemented in a spreadsheet. The most complex models use machine-learning algorithms over multi-season player-level data and require dedicated computational infrastructure.

The core mathematics is similar across complexity levels. Estimate the expected goals each team will score in a fixture based on their offensive and defensive performance against comparable opposition. Distribute those expected goals using a Poisson process to produce probabilities for each possible scoreline. Aggregate scoreline probabilities into match outcome, goals, BTTS, and other market probabilities.
The complexity sits in calibration. Raw shots data underestimates goal probability for teams that concentrate shots into high-quality positions. Expected-goals data is better calibrated but misses tactical context. Adding tactical context requires manual adjustment or sophisticated machine learning. Each calibration step adds accuracy at the cost of complexity, and the relationship between complexity and edge is not linear.
Where public data comes from and what it tells you
Most football betting models built outside professional operations rely on publicly-available data. Match-level statistics — shots, possession, expected goals, defensive blocks — are published by multiple sources for the major European leagues. Player-level data is patchier but accessible for the Premier League, Champions League, and major continental leagues.

The structural difference between public and proprietary data is granularity and timeliness. Bookmaker models use real-time data feeds with sub-minute latency, integrated tactical analysis, and proprietary calibration tuned against historical betting flow. Public data lags by hours or days, lacks tactical context, and isn’t calibrated against actual market behaviour.
That gap doesn’t make public-data modelling pointless — it makes it a specific kind of work. Models built on public data find edges in markets where the bookmaker’s proprietary advantage matters less: lower-tier leagues, longer-horizon outright markets, and specific submarkets the operator’s general-purpose model isn’t optimised for. Premier League 1X2 markets are not where public-data models earn their keep.
Expected goals as the modelling baseline
Expected goals (xG) is the foundational modern metric for football modelling. It assigns each shot a probability of becoming a goal based on shot location, angle, body part used, and defensive pressure. Sum the xG across a match and you have a measure of how many goals each team “should” have scored given the chances they created.
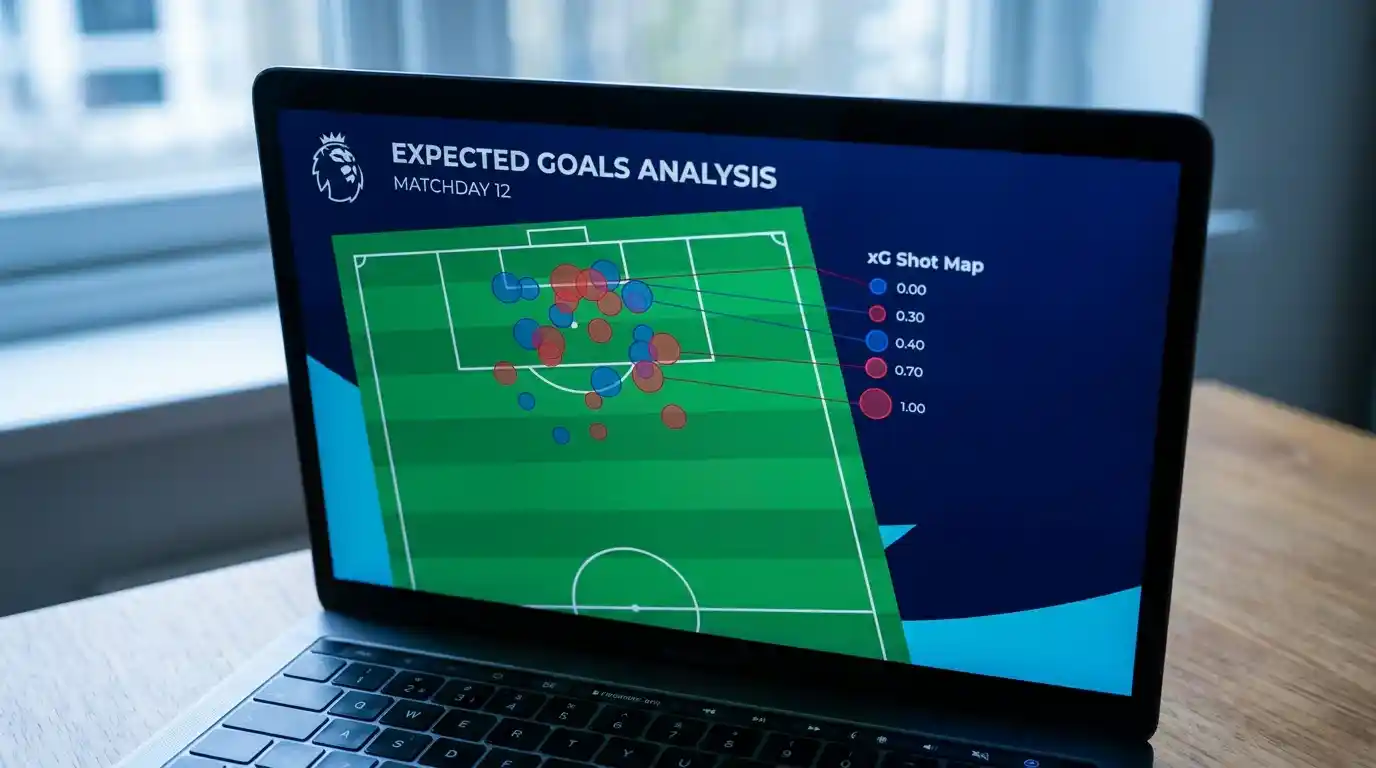
xG models do better than goal-counts at predicting future performance because they’re less affected by single-match conversion variance. A team that scored one goal from 2.5 xG in their last match outperformed expectation; that overperformance won’t sustain. The model output for next match should weight the 2.5 xG, not the single goal.
The structural limitation of xG is that it treats every chance as independent, which understates the value of teams that consistently create high-quality chances through deliberate buildup play. Tactical quality matters beyond the raw xG number, which is why xG alone produces baseline-quality probability estimates rather than market-beating ones. Layering tactical adjustments on top of xG is where the edge starts to appear.
The strength-of-schedule problem
Raw performance statistics need adjusting for opposition strength. A team posting 1.6 xG per match against Premier League bottom-six opposition isn’t equivalent to a team posting 1.4 xG per match against Premier League top-six opposition. The latter is the better team.

Adjusting for opposition strength is mathematically straightforward but operationally tricky. The simplest approach — multiply each match’s performance by an opposition-strength factor — works well at the season level but breaks down at the early-season level when sample sizes are too small to estimate strength reliably. Most modellers use multi-season rolling averages that update slowly enough to maintain stability but quickly enough to capture genuine performance shifts.
The strength-of-schedule problem is also why models perform better mid-season than they do in the opening weeks. Six matches of data per team gives enough sample for reasonable opposition adjustment. Two matches doesn’t. The wise modeller waits until October before placing serious weight on model output for any season.
Manager changes and structural breaks
Football data has structural breaks — moments where the underlying generating process changes and historical data stops being predictive. The most common structural break is a manager change. A new manager brings new tactical setups, often new starting lineups, and substantially different team behaviour patterns.

Models that don’t account for structural breaks systematically overestimate how predictive recent history is during transition periods. A team that was performing at one level under their previous manager might perform at a meaningfully different level under the new manager — but the model, weighting historical data, lags the adjustment by 6-10 matches.
Sportradar’s integrity monitoring systems use related techniques to identify when match patterns deviate from expected ranges across global football. Andreas Krannich, who runs integrity services there, has commented on how the 2025 review showed the importance of continued vigilance against fixing — and the same kind of pattern-deviation detection that catches integrity issues also catches structural breaks in normal performance data. Models that adapt to structural breaks faster than the market produce edge during transition periods.
The information edge in lower-tier football
Premier League data is over-supplied. Hundreds of public-data sites publish Premier League xG, defensive metrics, possession analytics. Operator models are tuned aggressively against this data. The information edge for a public-data modeller is near zero.

Championship data is less saturated. League One and League Two data is patchier still. The data quality at lower levels is sometimes worse, but the operator’s model investment is also less, which means the gap between public-data modelling and operator pricing is structurally narrower at lower tiers.
UK gambling reported £1.3bn in football GGY last year, with the substantial majority coming from Premier League fixtures. Operator model investment concentrates where the betting volume is. Lower-tier punters who model their own probabilities can compete with operator pricing in ways that Premier League punters generally can’t. The trade-off is that lower-tier markets have lower liquidity, smaller stake limits, and more variable margins — the edge is real but harder to scale.
Backtesting and the trap of in-sample tuning
Every model needs backtesting against historical data to validate its predictive performance. The trap is over-fitting to the historical sample. Add enough parameters to a model and you can perfectly explain any historical dataset — but the model will produce nonsense predictions on new data.
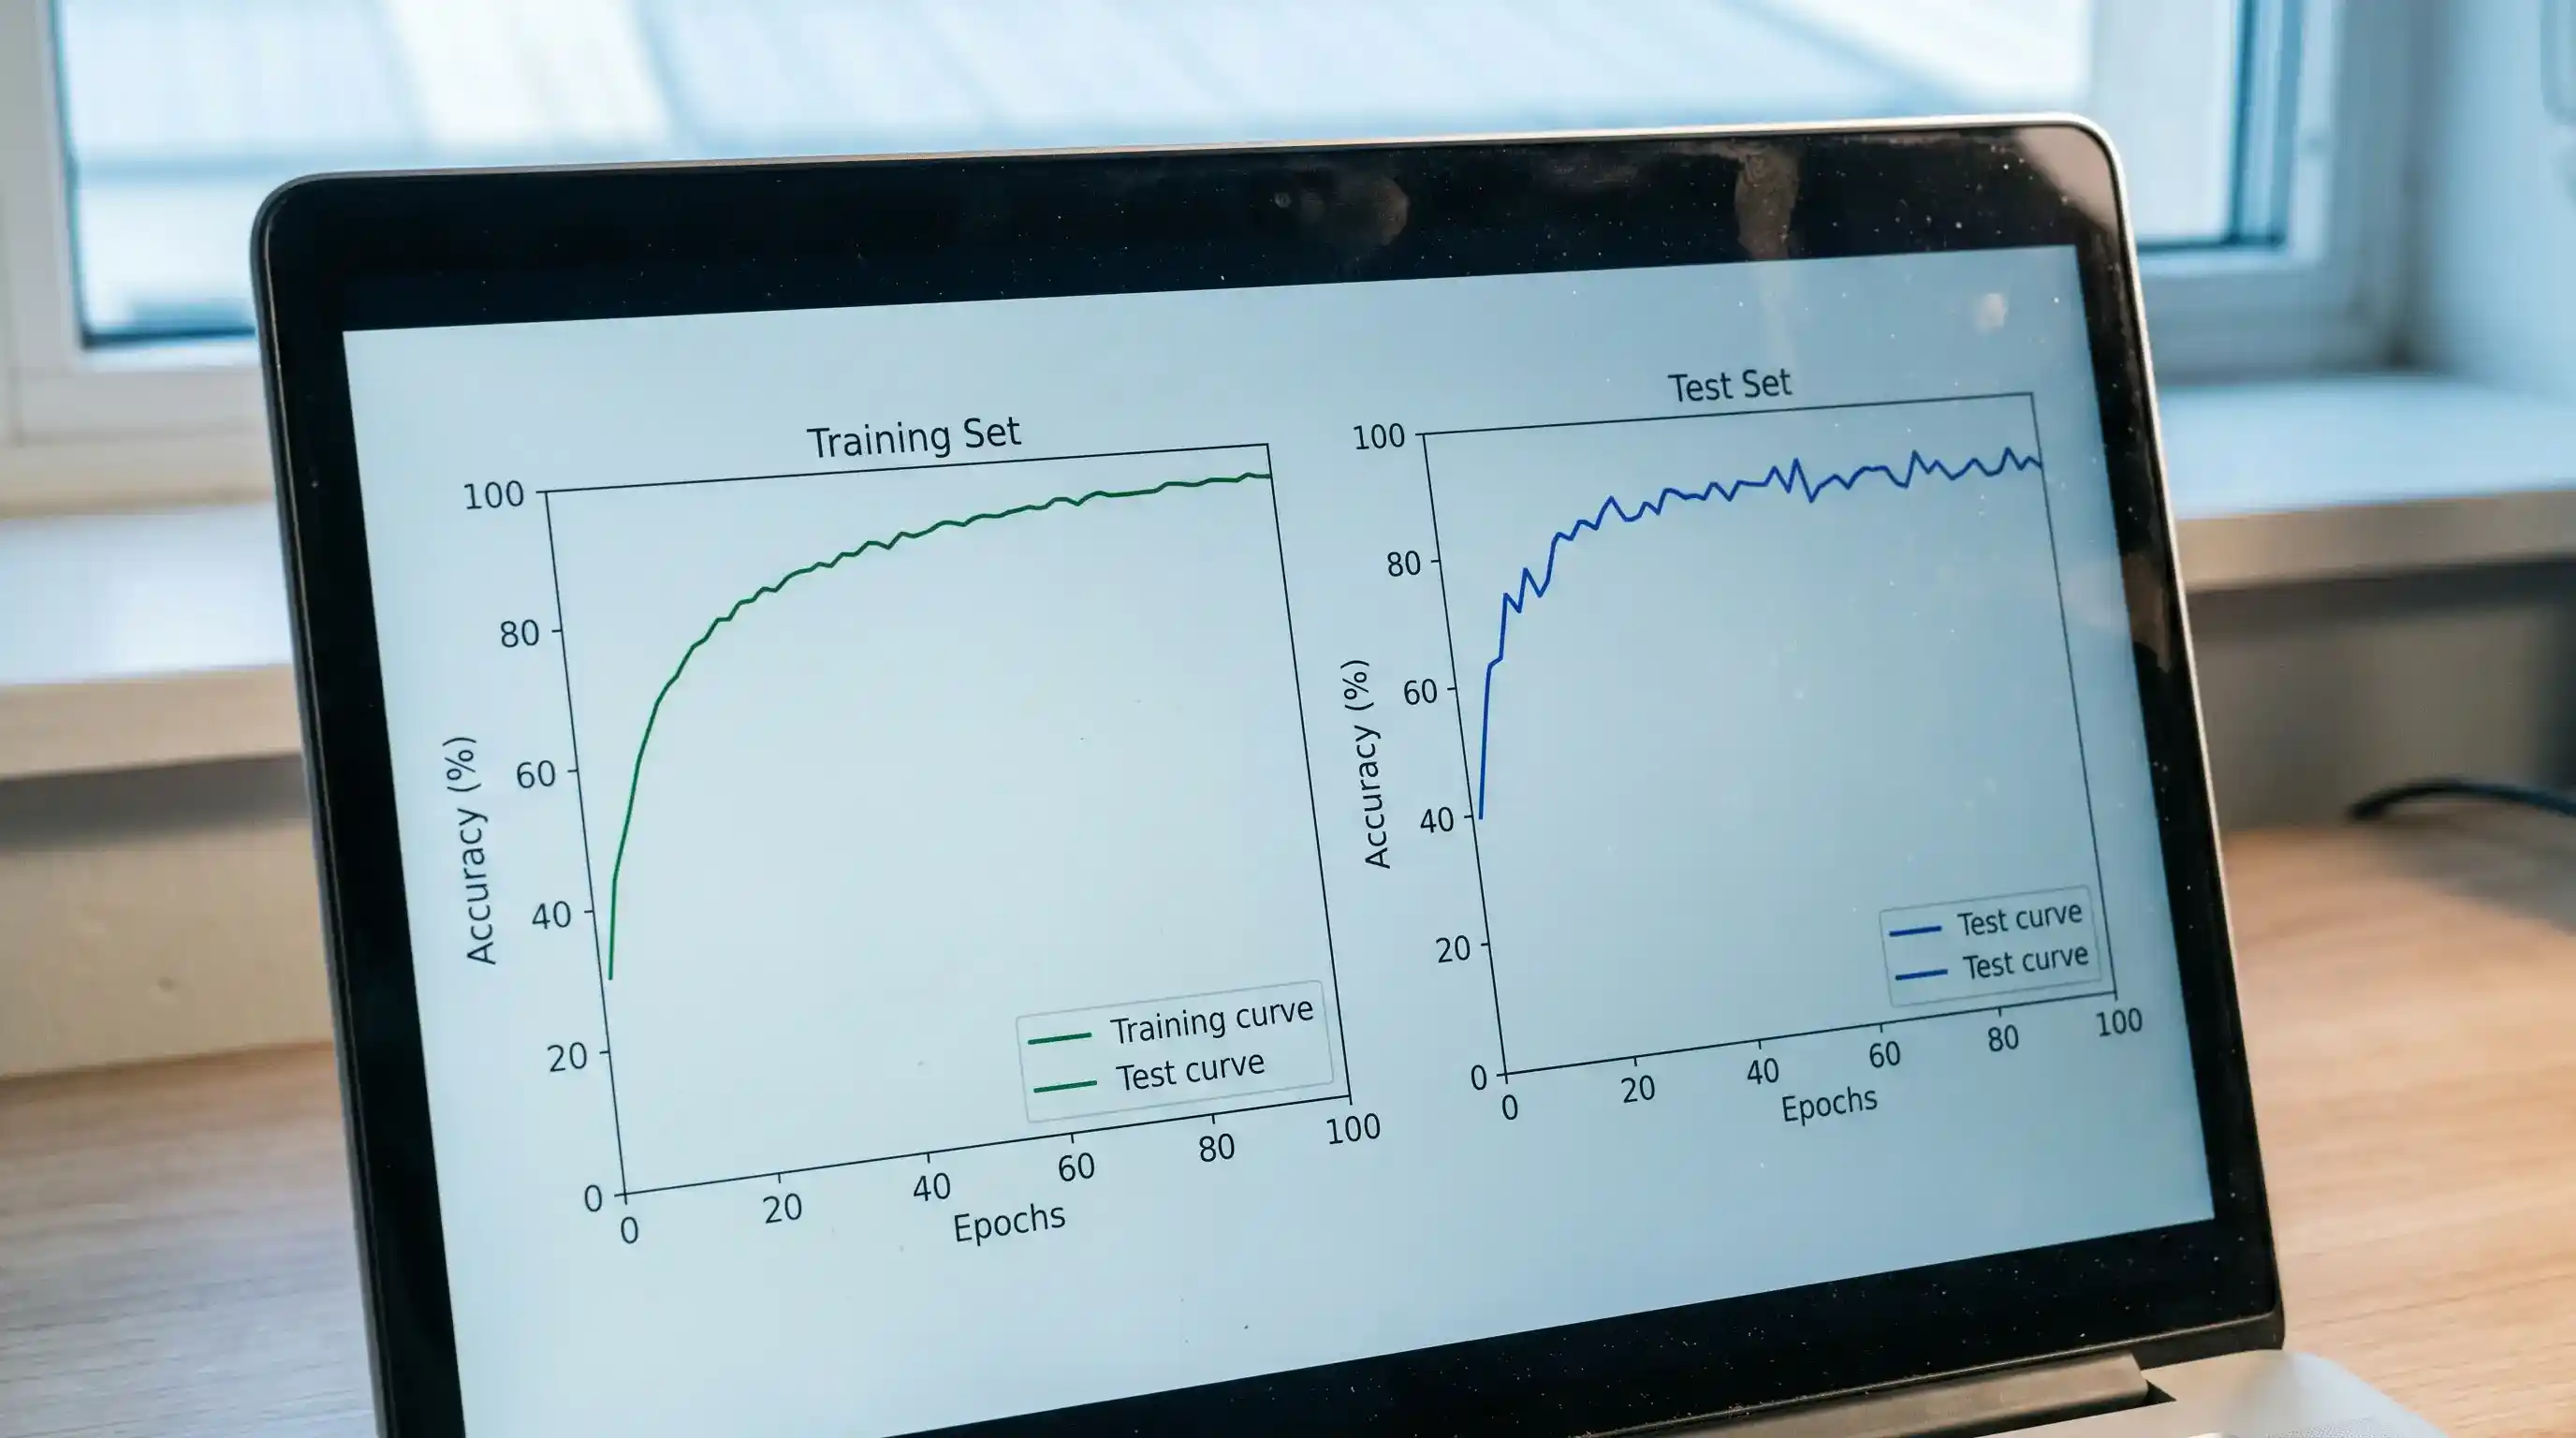
The disciplined approach is to split your historical data into a training set (for model calibration) and a test set (for performance validation). Tune the model parameters on the training set only. Measure performance against the untouched test set. If the test-set performance is substantially worse than training-set performance, the model is over-fit and needs simplification.
Most amateur football modellers skip this step and end up with models that look brilliant in backtest and lose money in production. The discipline of cross-validation isn’t optional — it’s the difference between a model that captures genuine pattern and a model that has memorised noise.
How models translate into betting decisions
A working model produces probability estimates. Value betting frameworks use those estimates against market prices to identify positive-EV bets. The link between model output and betting decision is a simple comparison: if model probability exceeds market implied probability by more than your minimum edge threshold, the bet has value.
The threshold matters. A model with 1% predictive edge over the market sounds promising but will fail in practice — operator overrounds are 5-10%, model error is itself 2-3%, and execution issues consume another 1-2% on average. The realistic minimum edge for production betting is around 4-5%, which means model probability needs to be at least 4-5 percentage points above implied probability before the bet clears the threshold.
Models that produce predictions barely above the threshold should be treated with scepticism. Models that consistently produce predictions 10+ percentage points above market implied probability are either genuinely sharp or genuinely buggy. Both cases need investigation before betting capital is committed.
What modelling teaches even if you never run a model
The discipline of modelling — defining what data matters, calibrating against history, validating against new data, comparing model output to market prices — produces better thinking even for punters who never build a formal model. The mental framework of “what data would change my view here” applies whether the data is integrated into a spreadsheet or just considered intuitively.
Punters who think in modelling terms make better selections than punters who think in narrative terms, even when the modelling-thinker doesn’t actually run formal probability estimates. The shift from “this team is in form” to “this team’s xG has trended upward for six matches against opposition averaging 1.4 xG conceded” is the entire difference between intuitive and analytical football betting.
Most UK punters operate in the intuitive frame. UK gambling reported 24.4M active accounts across the licensed market last year, and the punters who profit long-term across that population almost universally operate in the analytical frame. Whether they call themselves “modellers” or not, the underlying mental model is what separates them from the recreational majority who fund the entire ecosystem.
No, but you need to think in modelling terms. The discipline of asking "what data would change my view, and by how much" is what separates analytical from intuitive betting. Many profitable bettors use commercially-available models or selectively follow tipping services that publish edge calculations. Building your own model gives you control and learning value, but it"s not the only route to analytical betting. Lower-tier leagues where operator model investment is smaller. Championship, League One, and lower-tier European football all have weaker bookmaker pricing than the Premier League, where data saturation and competitive pressure produce extremely sharp markets. Specialisation in a specific league or market type produces more sustainable edge than spreading across everything. Several hundred bets across multiple months. Variance in football outcomes is high enough that small samples can"t distinguish skill from luck. A model showing 3% edge over 100 bets has a 95% confidence range from -8% to +14% — useless for validation. The same edge over 1,000 bets narrows to roughly -1% to +7%, which is meaningful. Plan for a full season of betting before drawing conclusions about model performance.Do I need to build my own model to bet football profitably?
Where do amateur modellers find the best edge?
How long does it take to validate a model"s edge?
This material was created by the Pitchledger team.
