

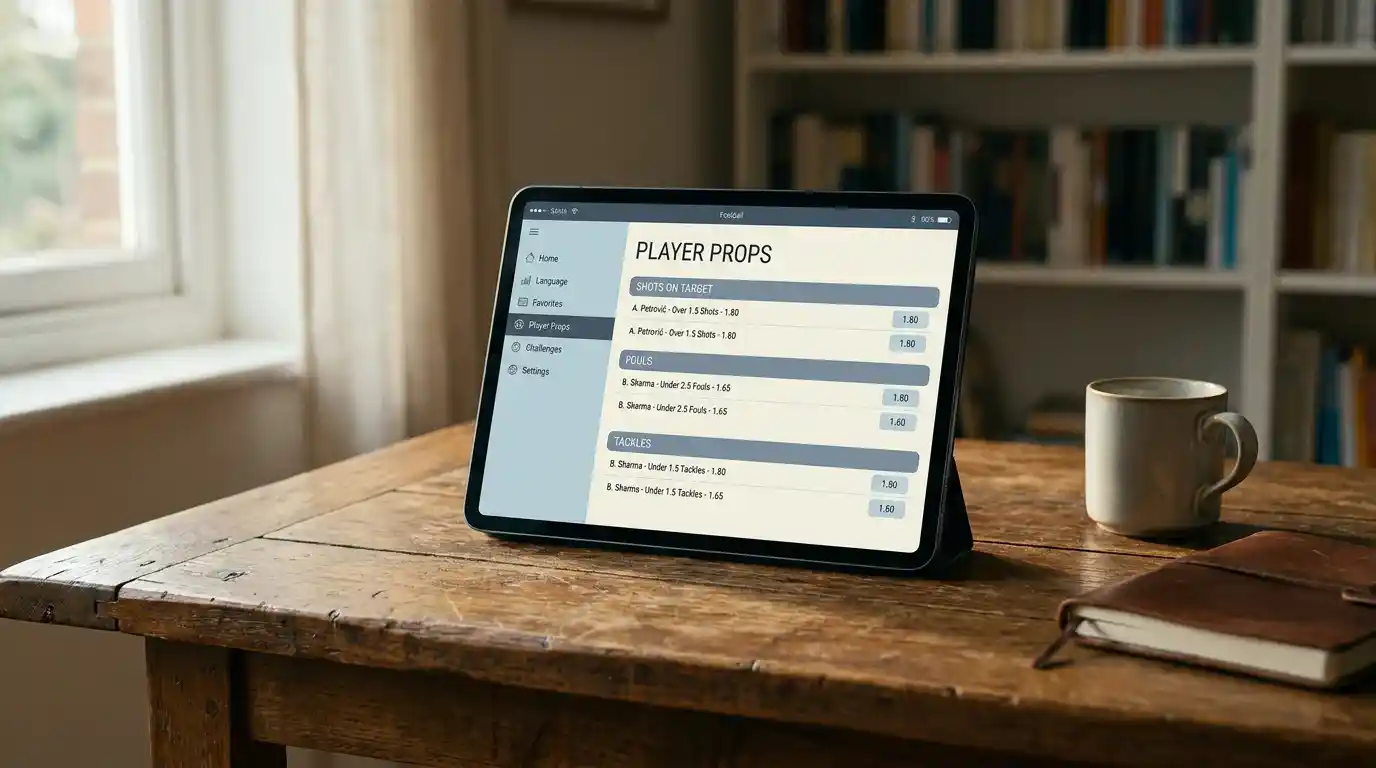
The afternoon I realised player data had outgrown the price models
A few seasons ago I was working on shots-on-target lines for a Premier League holding midfielder and noticed something odd. The operator had him at 1.5 shots on target with the over at 5/1. His average over the season to that point was 0.4 shots on target per match. He’d never hit two shots on target in a Premier League fixture. The over wasn’t a value bet — it was unwinnable for any rational reason.

That price wasn’t an error. It was the operator hedging against information they didn’t have. Player props markets exist in a strange middle ground where the data is enormous but the bookmaker’s confidence in their own model is patchy. Where the model is shaky, the price gets padded. Where the model is sharp, the price gets sharp too. Learning to tell which is which is the whole game.
How player prop pricing differs from match markets
Match markets get priced on team-level models that have been refined for decades. Player props are a different beast — they’re built on individual player rate data, multiplied by expected minutes, adjusted for opposition strength. Each input carries error. Combined, the error stacks up.
A typical shots-on-target line for a Premier League attacking midfielder might be set at 1.5 with the over priced 6/4. Expected minutes 75-80, opposition adjusted shot rate 1.7 per 90, conversion to on-target around 38%. Run that through and you get expected on-target shots of about 0.55, which gives an over-1.5 probability around 12-15%. The 6/4 price implies 40% probability — a 25-percentage-point operator margin on the over.

That’s why prop overrounds are so heavy. The operator is protecting against the fact that they might be modelling this particular player wrong, that their opposition adjustment might be miscalibrated, or that recent injuries might have shifted minutes. The padding is the cost of not having the same model precision they have for full-match outcomes.
Where shots and shots-on-target markets get pricing right
Shots and shots-on-target markets for first-choice strikers at top six clubs are some of the sharpest player prop lines in UK football betting. The data is rich, the player roles are stable, and the bookmaker has thousands of matches of training data per player.
A first-choice top-six striker priced at 3.5 total shots with the over at 5/6 usually implies 54% probability. Run the player’s actual rate against the opposition’s shot-conceded rate and you’ll often get something between 50% and 58% — the price is fair within the bookmaker’s margin. Same player at 1.5 shots on target with the over at 4/5 implies 56%, and the underlying rate usually sits 53-60%.
What this means in practice is that betting shots and shots-on-target on top strikers is essentially flat-equity unless you have specific information the bookmaker doesn’t have — injury status, tactical change, weather affecting playing surface. The market is sharp because the volume is high. Where the volume drops off — second-tier strikers, midfielders, defenders — the prices get fat and the value occasionally appears.
Passes and possession-based props
Passes completed is a market that exists primarily as an alternative for punters who want a “guaranteed action” prop with high frequency. A central midfielder at a possession-based team might be priced at 75.5 passes with the over at 5/6. That’s a line the player hits 60-70% of the time at home and 45-55% of the time away.
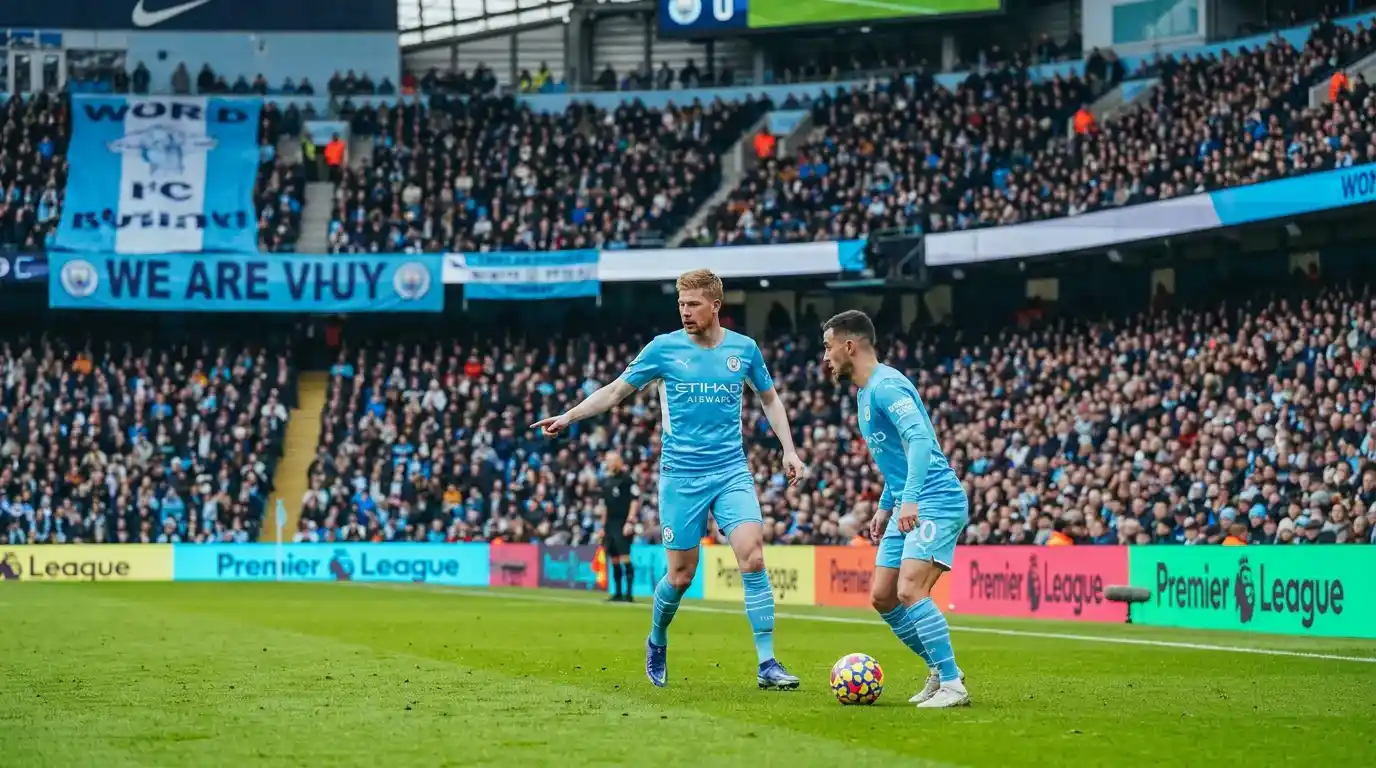
The structural feature of passes markets is the home-away split. Possession-based teams hold the ball more at home than away by about 8-12 percentage points. That propagates through to individual passes-completed numbers. A central midfielder averaging 80 passes per match at home might average 65 away. Bookmakers set the line at a midpoint and let the punter pick the side.
I avoid passes markets for two reasons. First, the overround is heavy — usually 108-112% on both sides. Second, the outcome is heavily influenced by red cards, early goals, and tactical setups in ways that aren’t reflected in pre-match data. A team that goes 1-0 down in the 20th minute changes their possession profile entirely. The passes line was set on an assumption the match doesn’t reflect.
Tackles, interceptions, and defensive props
Defensive player props — tackles, interceptions, blocks — are one of the few areas where information edges genuinely exist for UK punters with time to do the work. The reason is volume: streaming individual Championship and lower-tier fixtures gives you opportunities to spot defenders whose roles have shifted in ways the bookmaker hasn’t fully modelled.
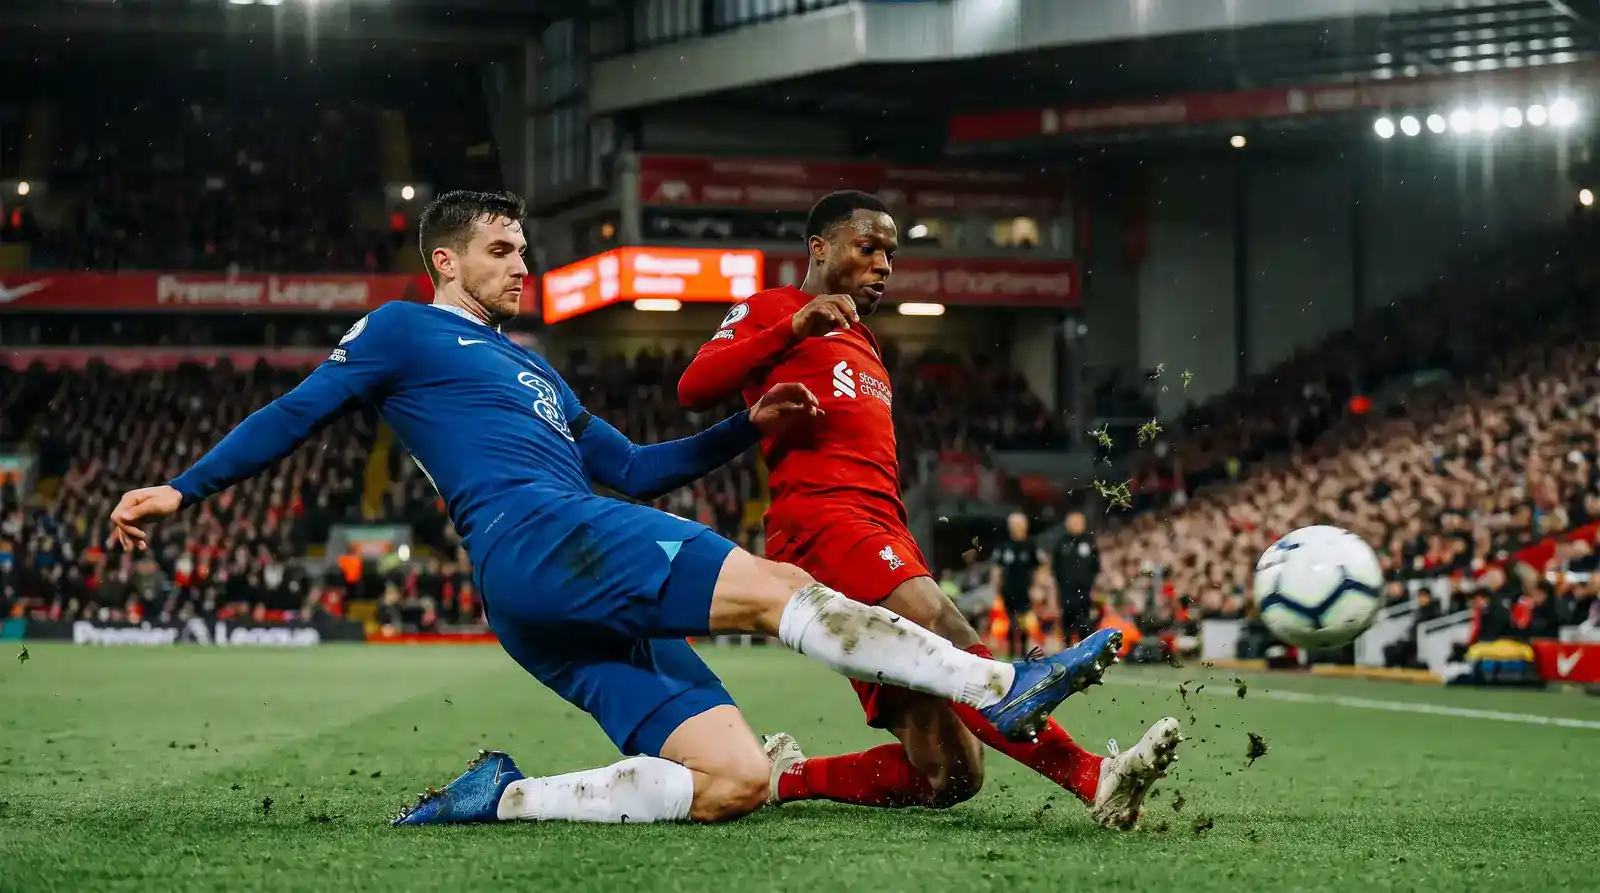
A full-back moved into a more attacking role under a new manager might post 1.2 tackles per match in his new system versus 2.8 in his old. The bookmaker’s line — set off rolling 10-game averages — might still sit at 2.5, which means the under is significantly mis-priced for a few weeks until the model catches up.
These edges close fast. By six matches into a tactical shift, the bookmaker has adjusted. But within that six-match window, defensive props are one of the cleaner profit opportunities in UK football betting. You need to be watching the football, not just looking at the prices.
Cards markets on individual players
Player to be booked, player to be carded — these are heavily-juiced markets but they offer occasional value when matched to specific player and opposition profiles. The base rate is the player’s yellow-card rate per match, usually published as cards per 90 minutes.
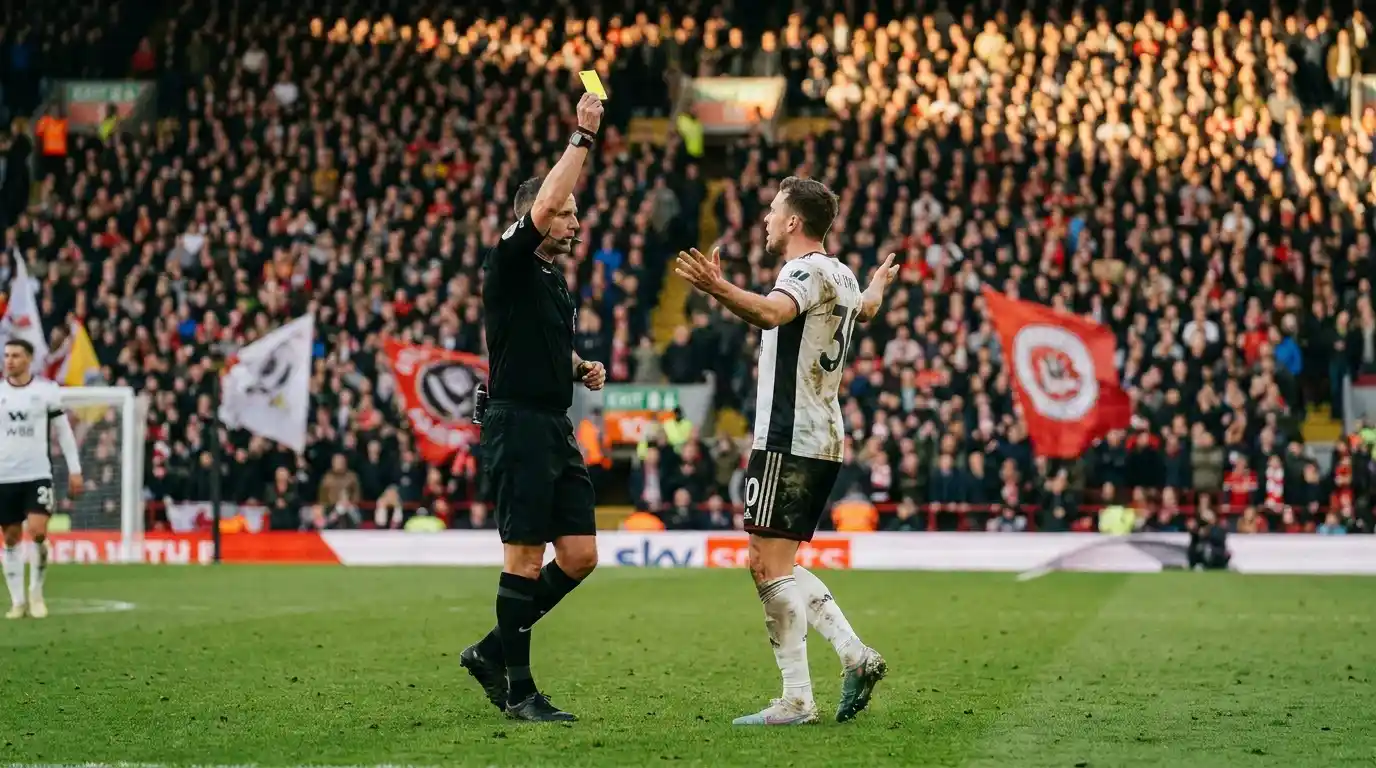
A combative central midfielder might average 0.35 yellows per 90, which translates to a 29% probability of being booked in a given match. Bookmaker price for “to be booked” anytime is typically 7/2 to 4/1, implying 20-22%. That’s the operator’s cushion — they don’t want to price the most-likely outcome too aggressively.
Where this market sings is when the same player is up against a specific opposition style — a fast-counterattacking team where his role requires more tackles in transition. The base rate doesn’t capture matchup specifics. A player who averages 0.35 yellows per match might be at 0.55 yellows per match against opposition with high pace and direct attacking. The price doesn’t move enough to reflect that.
This is also where match-integrity infrastructure becomes visible to punters. Live in-play card markets — “next player to be booked” or “player X to be next booked” — generate alerts in the integrity systems Sportradar runs for major leagues. The relative stabilisation of suspicious match patterns across European football in recent reporting periods has been described by Andreas Krannich of Sportradar as encouraging but a reminder of the need for continued vigilance, and individual-player markets are precisely the markets that come under that scrutiny because they’re easier to spot-fix than match outcomes.
The combination market everyone wants and few bet well
Player props plug into same-game multis with terrifying flexibility. “Striker to score and to have 3+ shots and to be on the winning team” is a three-leg combo that any UK app will offer. The price will be 3/1 or longer on a moderately-favoured striker.
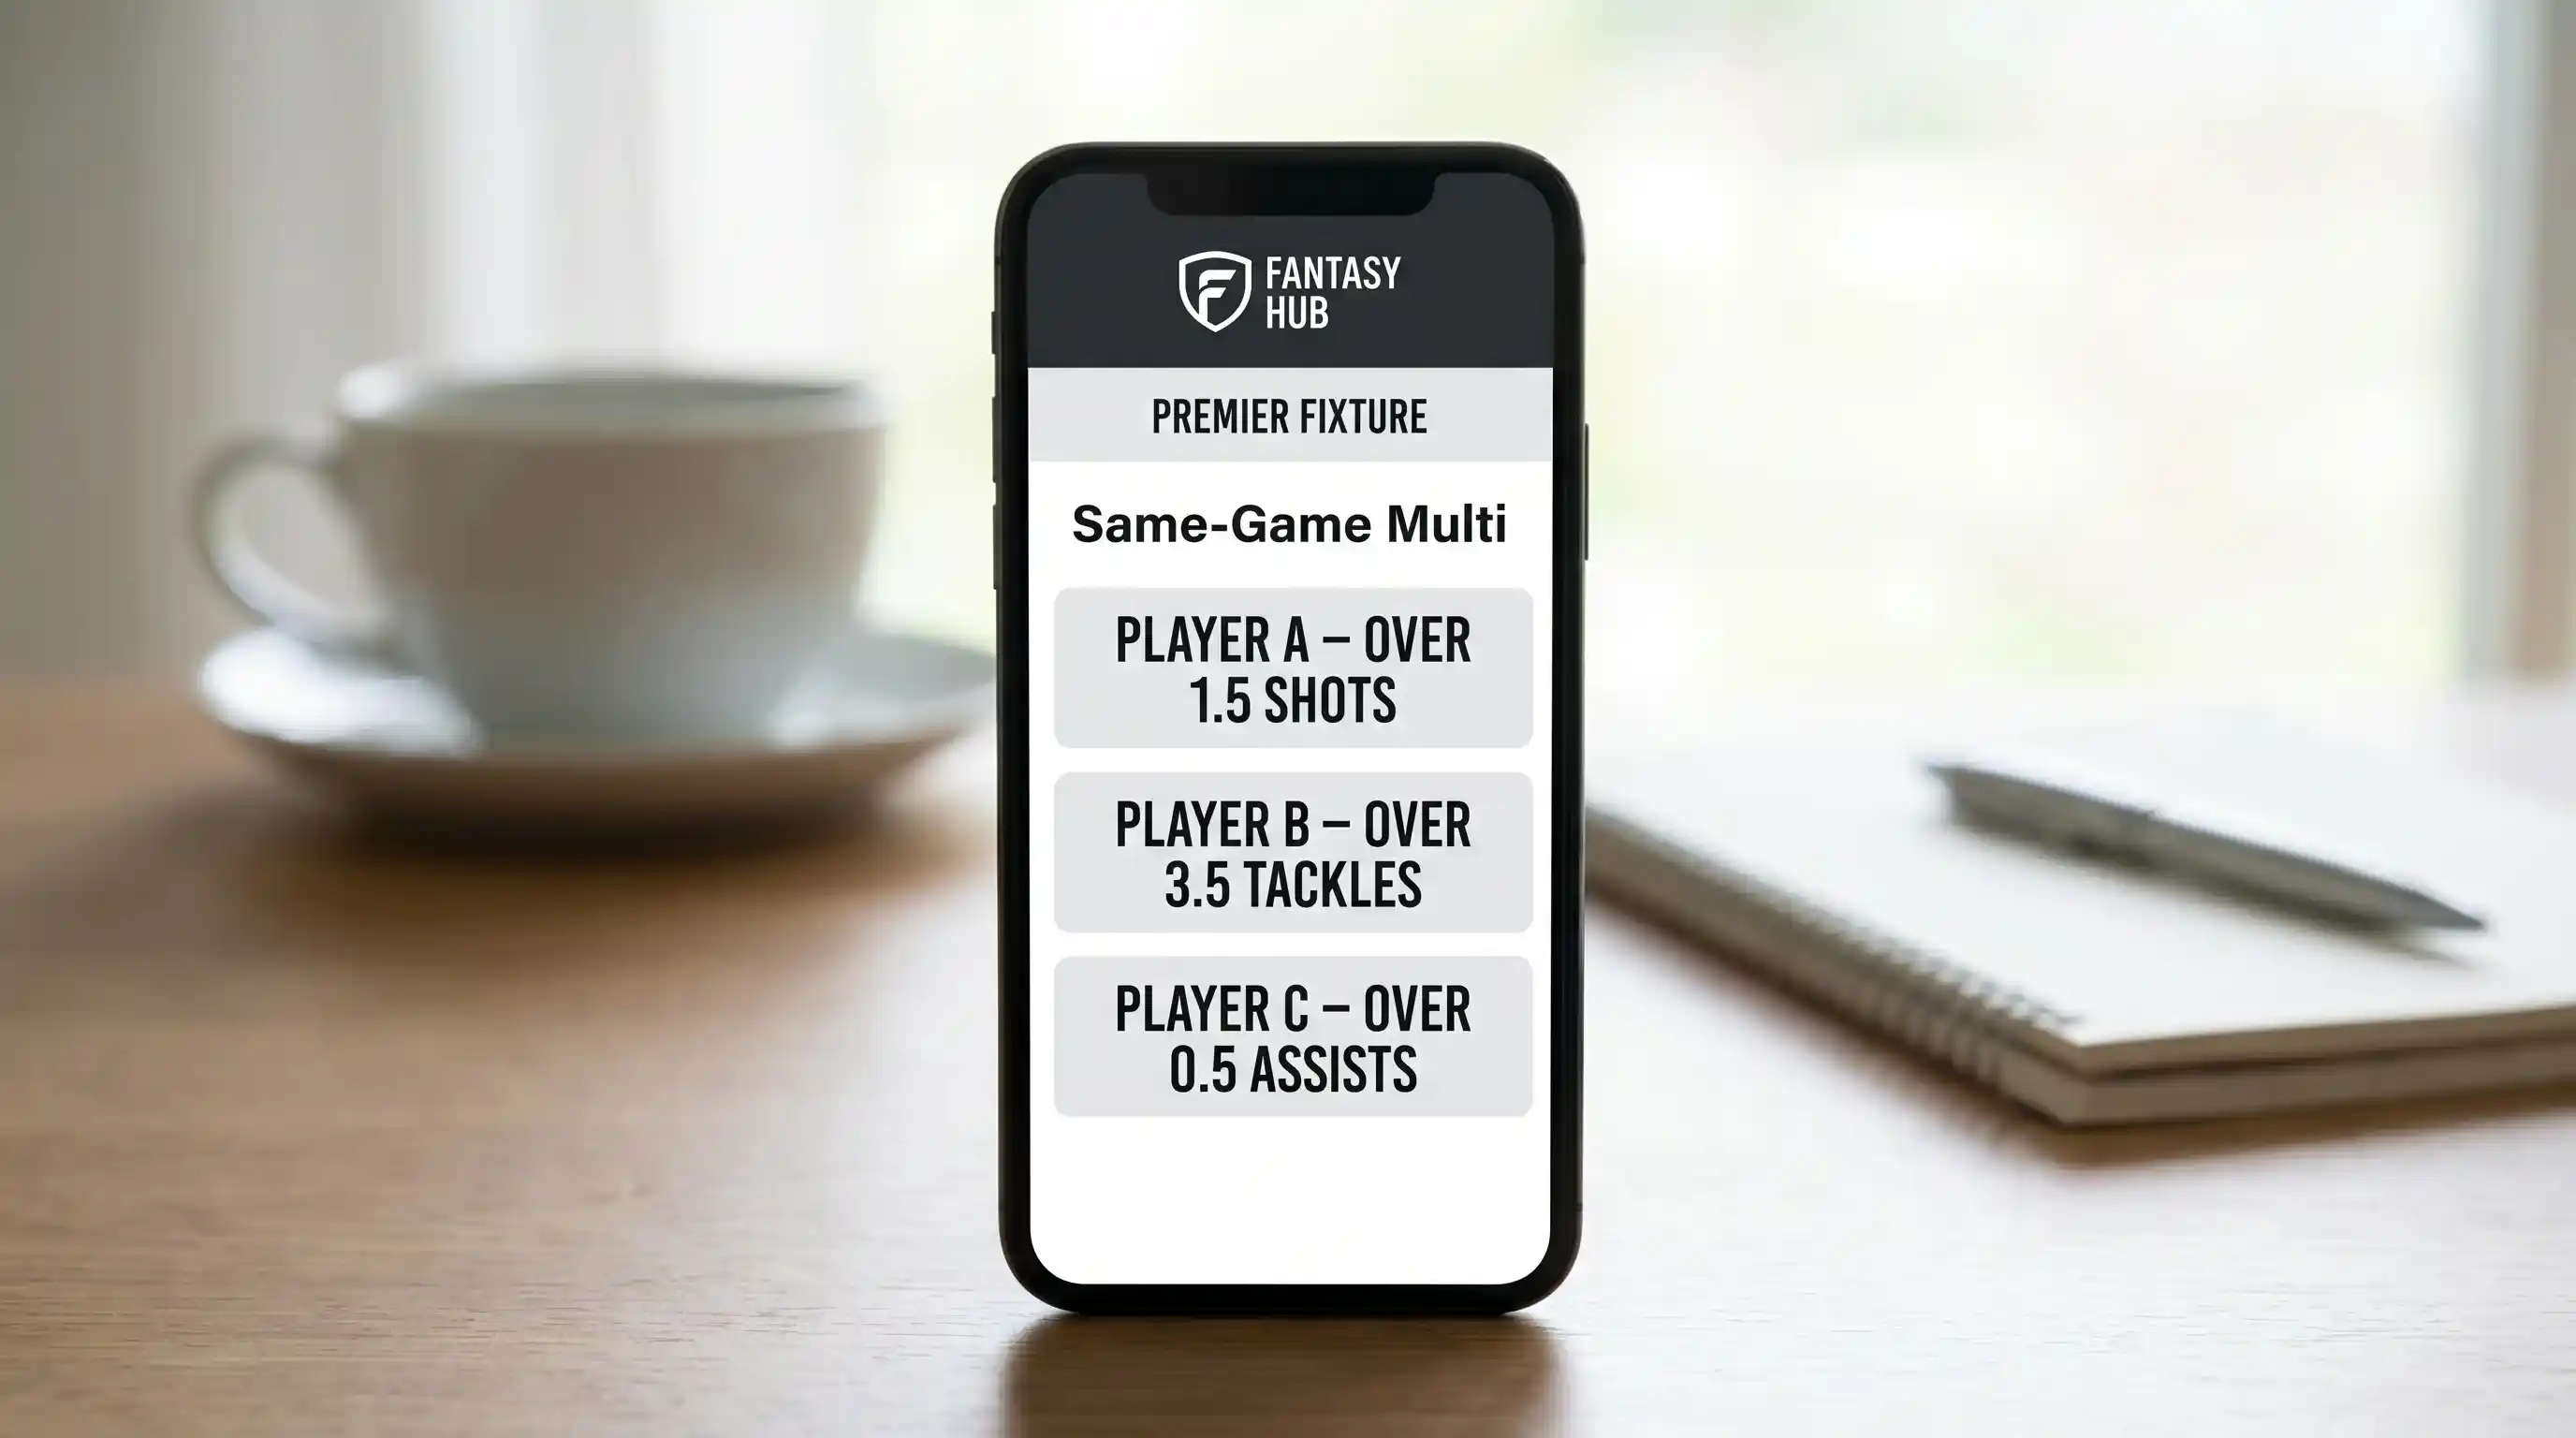
The trap is correlation. Those three legs aren’t independent — if the striker scores, he probably hit 3+ shots. If he scored and his team won, those two outcomes are heavily correlated. The bookmaker knows this and bakes the correlation discount into the price. But the discount is usually less aggressive than the actual correlation, which means the combination usually displays a price that overstates its true probability.
That’s not value going to the punter — that’s the operator’s correlation pricing being conservative against the punter. The combination price might look like 3/1 with implied 25% when the actual probability is closer to 18-20%. The operator wins long-term because the actual hit rate is below the price implies, even after correlation discount.
Where player props fit a 2026 betting profile
Player props are now central to how operators acquire and retain customers. UK gambling recorded 34M new registrations across 24.4M active accounts last year, and the marketing copy that’s drawing those registrations is almost entirely about player markets and bet builders, not match outcomes.
That commercial reality is why the prop markets get richer every season — more lines, more players, more in-play prop alternatives. It’s also why the margins stay heavy. The volume is concentrated, retail flow is consistent, and operators don’t need to compete on prop overrounds the way they compete on outright match prices.
For the disciplined punter, that means props are a market to be selective about. Bet the sharp lines on high-volume players at flat equity. Bet the fat lines on lower-tier players only where you’ve genuinely watched the football and spotted a model lag. Avoid the temptation to throw props into every same-game multi just because the screen looks more colourful with them. The screen is designed to encourage that exact behaviour.
Generally no — they"re sharp because the volume is high and the data is rich. You"ll get flat equity at best, unless you have specific information the bookmaker doesn"t have, like late injury news or weather affecting the pitch. The value in props lives in lower-tier players and tactical shifts that haven"t been picked up by the model. Because tactical role changes propagate slowly through bookmaker models. A full-back moved into a more attacking position under a new manager will see his tackle rate drop, but the model uses rolling averages and takes 6-10 matches to catch up. Within that window, the under on his tackles line offers genuine value. Conservatively. They build in a correlation discount so the displayed price is shorter than independent multiplication would give, but the discount is usually less aggressive than the actual correlation. That"s not value — it means the displayed price overstates the bet"s true probability, and the operator"s margin sits inside that gap.Are shots-on-target markets value plays for top strikers?
Why are defensive props sometimes mis-priced?
How do operators price correlation in same-game multis with prop legs?
This material was created by the Pitchledger team.
